Trend Following Strategies
Introduction to Trend Following Strategies in Crypto Markets
Introduction to Trend Following Strategies in Crypto Markets
Trend following is a popular strategy used by traders and investors across various financial markets, including the crypto market. This strategy focuses on identifying and capitalizing on market trends, regardless of the cryptocurrency’s direction. In simpler terms, it aims to ride the wave of upward or downward price movements.
Trends can be observed in the form of consistent price increases or decreases over a certain period. Trend followers believe that these trends tend to persist, making it possible to generate profits by following and trading based on them.
The premise behind trend following strategies is that markets exhibit patterns and tendencies, allowing traders to implement a systematic approach to take advantage of these trends. While no one can predict future market movements with absolute certainty, trend followers believe that trends are more likely to continue than reverse in the short term.
One of the key tools utilized by trend followers is technical analysis. It involves studying historical price data and charts to identify patterns and determine potential future price movements. Popular technical analysis indicators like moving averages, MACD (Moving Average Convergence Divergence), and RSI (Relative Strength Index) are often used by trend followers to make informed trading decisions.
In terms of execution, trend following strategies provide specific criteria for entering trades. Traders often take long positions (buying) when they identify an uptrend and short positions (selling or taking a position against a particular cryptocurrency) during a downtrend. The goal is to capture as much of the trend as possible before exiting the trade.
Risk management is crucial when employing trend following strategies in crypto markets or any other financial market. Stops and trailing stops are commonly used to protect against adverse market moves. These tools automatically close a position once prices reach predefined levels or trail behind the price at fixed intervals, securing profits accumulated during the trend.
Understanding that not every trade will be successful, trend followers aim for favorable risk-to-reward ratios. By ensuring their potential profits significantly outweigh potential losses, they can still generate returns overall even if a significant number of trades end with losses.
Trends in crypto markets can be affected by various factors, including news events, market sentiment, and even general market conditions. Therefore, it’s essential for trend followers to keep a close eye on both fundamental analysis (economic, policy, and industry-related trends) and technical analysis indicators while executing their strategies in the crypto market.
To summarize, trend following strategies in crypto markets revolve around identifying and capitalizing on price trends that persist over a certain period. By utilizing technical analysis tools and implementing risk management measures, traders attempt to profit from these trends using systematic trading approaches. However, it’s important to note that past performance is not indicative of future results, promising no guaranteed success with this or any strategy.
How To Identify Market Trends In Crypto Trading
Identifying market trends in crypto trading can be a challenging yet crucial task for those looking to make informed investment decisions. By closely observing the market and analyzing relevant data, traders can gain valuable insights into market trends that can potentially help maximize their profitability. Here is everything you need to know about how to identify market trends in crypto trading:
- Price Analysis:
Traders often perform technical analysis by studying price charts and patterns of cryptocurrencies. By identifying specific price levels, support and resistance zones, trendlines, and key indicators such as Moving Averages or Relative Strength Index (RSI), one can detect distinct patterns that may indicate a trend. - Volume Analysis:
Analyzing trading volume helps to assess the strength of a given trend. Higher trading volumes during upward trends indicate strong bullish sentiment, while increased volumes during downward trends suggest a bearish market sentiment. - Fundamental Analysis:
Understanding the underlying factors affecting a cryptocurrency’s value is essential. Consider looking into project updates, new partnerships, regulatory developments, adoption news, or market sentiment towards particular cryptocurrencies to identify potential trends. - News Monitoring:
Keeping an eye on current news and events related to the crypto industry can be highly beneficial. Developments like significant partnerships, exchange listings, project milestones, or government regulations can influence the market trends. - Social Media Sentiment:
Utilizing sentiments shared on social media platforms can offer insights into public opinion towards cryptocurrencies. However, consider being cautious as speculative information might not always represent a reliable source of accurate analysis. - Technical Indicators:
Technical indicators identify certain parameters based on mathematical calculations and statistics derived from historical pricing data. By carefully interpreting these indicators like MACD (Moving Average Convergence Divergence), Bollinger Bands, or Stochastic Oscillator, traders can gain indicators of emerging trends. - Time Frame Consideration:
Different trends have varying time frames; thus, evaluating various chart time frames (e.g., hourly, daily, weekly) helps identify short-term or long-term trends accurately. - Moving Averages:
Moving averages calculate average price values over a specified period to provide insights into the price direction. Commonly used moving averages include the 50-day and 200-day moving average lines. Crossovers, where two moving averages converge, could imply trend reversals. - Resistance and Support Levels:
Resistance levels are price levels where cryptocurrencies encounter selling pressure limiting further upward movement. Conversely, support levels denote price thresholds where purchasing demand outweighs selling pressure, creating a floor for prices to potentially bounce back. - Trend Confirmation:
Always exercise caution in confirming trends using multiple indicators and techniques! Relying solely on one factor may lead to inaccurate analysis or false signals.
Remember, no prediction method can guarantee profitable outcomes when identifying market trends in crypto trading. The crypto market is highly volatile and subject to sudden shifts based on both fundamental and psychological factors. Keeping yourself updated with reliable sources, using analytical methods alongside risk management practices, and adapting your strategy when necessary can enhance your ability to navigate emerging market trends effectively.
The Psychology Behind Trend Following in Cryptocurrencies
The psychology behind trend following in cryptocurrencies is an intriguing aspect of the crypto market that captivates various traders and investors. Trend following is a strategy commonly employed to make trading decisions based on the indicators of price movements over time.
One psychological factor that influences trend following is the fear of missing out (FOMO). The crypto market is known for its volatility, which leads many traders to jump into trends based on the fear that they may miss out on potential profits. FOMO often leads to impulsive buying decisions, increasing demand and driving up the prices of certain cryptocurrencies.
Another psychological element influencing trend following is the need for confirmation bias. Traders tend to seek out information that confirms their existing beliefs or expectations about a particular trend. They may ignore or discount contradictory information, leading them to stay committed to a trend even when signs of a reversal emerge.
Emotional trading also plays a significant role in trend following psychology. Strong emotions like fear and greed can cloud judgment and lead traders to make irrational decisions. When markets experience rapid price movements, fear can cause traders to sell impulsively instead of holding onto a potentially profitable position. Conversely, greed may overpower rationality, compelling individuals to buy into rising trends without considering critical factors such as market fundamentals and risks.
Psychological biases such as anchoring bias impact trend following as well. Anchoring bias occurs when individuals rely heavily on one specific information point (often the initial purchase price) when making subsequent decisions. Traders may fixate on their entry point into a trend, ignoring changing market conditions and potentially prolonging losses if the trend reverses unfavorably.
Overconfidence can also sway traders towards trend following strategies. The belief that they can accurately predict market trends may lead individuals to take exaggerated risks, overestimate profitability, or disregard risks associated with entering ongoing trends without proper analysis.
Furthermore, social proof plays a significant role in influencing traders practicing trend following. When influential figures or public figures, such as well-known investors, politicians, or celebrities, express their support for a particular cryptocurrency or trend, it leads to increased social proof. Traders may imitate these perceived successful individuals, leading to intensified trends, reinforced by the actions of others.
Finally, value attribution and sense-making assist traders in understanding why a trend is occurring and what might drive its persistence. They search for reasonable explanations surrounding market shifts to rationalize followings trends. This helps traders construct and navigate narratives surrounding market movements, making them feel more confident about pursuing trend following strategies.
Understanding the psychological factors at play behind trend following in cryptocurrencies can provide insights into investor behavior and potentially help traders make informed decisions. By recognizing the impact of emotions, biases, social influence, and individual perception on the crypto market, traders can navigate trends with greater awareness of the psychological landscape shaping these trends.
Essential Tools and Indicators for Crypto Trend Followers
When delving into the crypto market news and trends, it is crucial to utilize a set of essential tools and indicators that can help guide trend followers in making informed investment decisions. While there are numerous tools available, here are some key ones to consider:
- Candlestick Charts: Candlestick charts provide visual representations of price movements over a given time period. It helps identify patterns, market sentiment, and possible future price trends. Analyzing candlestick formations is integral for understanding market dynamics.
- Moving Averages (MA): Moving averages are used to determine average price values over specific periods, providing insights into overall market trends. Common types include simple moving averages (SMA) and exponential moving averages (EMA).
- Relative Strength Index (RSI): The RSI measures the speed and change of price movements by comparing the magnitude of recent gains to recent losses. This oscillator indicator ranges from 0 to 100, with values above 70 indicating overbought conditions and values below 30 suggesting oversold conditions.
- Volume Charts: Volume charts represent trading activity by illustrating the subsequent buying and selling pressure behind price movements. They assist in identifying strong trends and potential reversals based on trading volume patterns.
- Bollinger Bands: Bollinger Bands consist of three lines—upper, lower, and middle—that surround a simple moving average line. They indicate possible price volatility by showing standard deviations from the moving average. Tighter bands suggest lower volatility, while wider bands indicate higher volatility.
- MACD (Moving Average Convergence Divergence): MACD reflects the relationship between two moving averages and further helps traders identify potential trend reversals or confirmations. It comprises two lines—the MACD line and the signal line—along with a histogram that represents the difference between them.
- Fibonacci Retracement: Based on Fibonacci ratios in mathematics, this tool identifies potential levels of support or resistance in a market. It helps determine possible price reversal points or areas to consider for entry or exit positions.
- Order Book (Depth Chart): The order book displays current buy and sell orders at various price levels, indicating market liquidity and potential support or resistance zones for a particular cryptocurrency.
Remember, the effective utilization of these tools and indicators takes time and practice. They are not definitive predictors but can significantly enhance one’s understanding of crypto market trends, assisting in making thoughtful trading decisions.
The Impact of Major News Events on Crypto Market Trends

The Impact of Major News Events on Crypto Market Trends
Major news events have a significant influence on trends within the crypto market. These events often result in notable price fluctuations and changes in investor sentiment. Here we explore how major news events impact the crypto market:
- Regulatory news: Government regulations can greatly impact crypto prices. News related to legal policies, restrictions, or proposed bans on cryptocurrencies can cause dips and volatility. Likewise, announcements of regulatory frameworks or acceptance of cryptocurrencies by governments can create bullish sentiments and drive price upswings.
- Partnerships and integrations: The market is sensitive to news of collaborations between blockchain projects and traditional companies or well-known brands. Positive partnerships, such as when a tech giant incorporates blockchain technology into its operations, often lead to increased confidence in the underlying cryptocurrency, leading to price surges.
- Security incidents: News reporting hacking attacks or data breaches affecting crypto exchanges or specific digital currencies trigger negative responses in the market. Security incidents put investor trust at risk, leading to rapid selloffs and downward price pressure.
- Economic developments: Broader economic events, like interest rate decisions, trade tensions, or geopolitical crises, can indirectly affect cryptocurrency prices. For instance, during economic crises or periods of hyperinflation, some investors turn to cryptocurrencies as a store of value—leading to increased demand and price elevations.
- Technological advancements: Positive technological news within the crypto space can generate bullish reactions. Development updates, successful implementation of new protocols or smart contracts, scalability solutions, or improvements in speed and security can incite positive market sentiment and potential price pumps.
- Market manipulation: Fears or evidence of market manipulation can shake the confidence of holders and traders alike. Rumors about price manipulation through pump-and-dump schemes, fraudulent activities, or insider trading can lead to panic selling precipitating sharp price drops.
- Mainstream adoption: Announcements of mainstream businesses accepting cryptocurrencies as payment can boost market sentiment and drive prices higher. Integrations, partnerships, and expansions of well-established companies into the crypto domain show the potential for increased utility and adoption, positively impacting market trends.
- Media coverage: Events covered by mainstream media can heavily influence movements within the crypto market. News stories highlighting excessive volatility, regulatory uncertainties, or fraudulent activities tend to cast a negative shadow, leading to downtrends. Conversely, positive media coverage highlighting significant use cases, innovations, or success stories can contribute to bull markets.
In the volatile domain of cryptocurrencies, paying attention to major news events is crucial for understanding market trends. Constant monitoring can help investors and traders make informed decisions as they gauge the potential impact of news on prices and market sentiment.
Best Practices for Setting Stop Losses in Trend Following
When it comes to trend following in the volatile world of cryptocurrency, one crucial tool that traders often employ is setting stop losses. By implementing this risk management strategy, traders can protect their investments from sudden market fluctuations and potentially mitigate losses.
- Trend identification: Before setting a stop loss, it’s essential to identify the current trend. Whether the overall trend is bullish or bearish will influence your decision-making process. Analyzing technical indicators and patterns on charts helps gauge the direction of the prevailing trend.
- Support and resistance levels: Consider support and resistance levels when setting your stop loss position. These levels signify areas on a chart where there tends to be either buying pressure (support) or selling pressure (resistance). Placing your stop loss just below a strong support or resistance level may offer an added layer of protection.
- Volatility analysis: The inherent volatility of the crypto market necessitates careful consideration. Assessing recent price swings and historical volatility can help determine an appropriate buffer for your stop loss position. Higher volatility might warrant a wider gap between your entry price and stop-loss order to accommodate price fluctuations.
- Risk versus reward: Establishing risk-reward ratios is essential within any trading strategy. When setting stop losses, consider the potential reward you anticipate from a particular trade compared to the risk you are taking. A higher-risk trade might require tighter stop loss placement to preserve capital, while lower-risk trades may offer more flexibility.
- Trailing stop losses: Trailing stop losses are a popular method among trend-following traders. As the trade moves in your favor, you adjust your stop-loss order accordingly to protect your profit or minimize potential losses. This technique allows you to capture profits in times of favorable market conditions while also protecting against adverse shifts in trends.
- Maintaining discipline: Discipline is a paramount virtue in setting stop losses effectively. Emotional decision-making can lead to poor judgment or hesitations that compromise one’s risk management approach. Stick to your initial plan and follow predetermined stop-loss levels, even if it goes against your sentiments during sudden price fluctuations.
- Regular reevaluation: Periodically reassess and adjust your stop losses as the market conditions evolve. Markets can exhibit changing trends or unique circumstances that affect the trajectory of your investment. Being mindful of these changes enables you to adapt your strategies optimally to current market sentiment.
- Backtesting and evaluation: Consistent improvement is crucial in any trading practice. Conducive to this growth is the process of backtesting and evaluating the effectiveness of different stop-loss placement scenarios based on previously collected data. Analyze previous trades to fine-tune your stop loss approach and identify what works best for your trading style.
Remember, setting stop losses for trend following in the crypto market is interwoven with risk management. It leverages technical analysis, volatility assessment, and an objective perspective toward potential rewards and risks. These practices protect traders’ capital while empowering them to engage profitably in dynamic cryptocurrency markets.
Comparing Short-Term vs Long-Term Trend Following in Cryptos
When it comes to Crypto Market News, understanding the differences between short-term trend following and long-term trend following is crucial. Both strategies carry their own advantages and drawbacks, catering to different trading styles and objectives.
Short-term trend following focuses on identifying temporary market trends that last from a few hours to a few days. Traders using this approach rely on technical indicators, chart patterns, and algorithmic analysis to capture shorter price movements. They aim to profit from rapid market fluctuations or capitalize on short bursts of volatility.
The primary advantage of short-term trend following is the potential for quick profits. Traders can enter multiple trades over a shorter timeframe, creating opportunities to generate small but frequent gains. Adopting this strategy requires attentiveness, as one must closely monitor the markets and respond swiftly to emerging trends.
However, navigating short-term trends poses challenges due to market noise and sudden price swings that may trigger false signals. As the market can quickly change direction, effective risk management becomes crucial. Moreover, relying solely on technical analysis may overlook fundamental factors driving long-term price movements.
Long-term trend following in the crypto market focuses on identifying broader price trends that extend over months or even years. Traders employing this strategy aim to ride major bull runs or bear markets by holding their positions for a prolonged period. They often combine technical analysis with comprehensive research on project fundamentals, industry developments, and wider market conditions.
One significant advantage of long-term trend following is the potential for capturing substantial price appreciation during extended upward trends. By aligning investment decisions with fundamental growth indicators, traders may spot promising projects with long-lasting profitability prospects. In contrast to short-term trading, this approach generally requires less frequent trading activity and leaner transaction costs.
Nevertheless, prolonged market downturns or emerging risks can lead to considerable drawdowns in long-term positions. Patience, discipline, and adherence to risk management practices are important qualities for successful long-term traders. Furthermore, staying informed about changing project dynamics and fundamental factors is crucial to avoid holding positions in declining assets.
Understanding the divergences between short-term and long-term trend following approaches is essential before deciding a suitable strategy. While short-term trading is characterized by frequent trades and more immediate profits, it requires constant vigilance. Conversely, long-term trend following focuses on capturing significant price movements across extended periods, but traders must practice patience and diligence during market downturns.
Ultimately, determining which approach works best depends on an individual’s risk tolerance, available time commitment, trading expertise, and investment goals. Some traders choose to use a combination of both strategies to diversify their portfolios and leverage varying market conditions.
Real-life Success Stories of Trend Following in the Crypto Space
Trend following has emerged as a popular strategy in the crypto space, with several success stories showcasing its potential. These real-life examples have demonstrated how individuals and organizations alike have reaped significant profits by following market trends and making informed decisions. Here are some noteworthy success stories that exemplify the power of trend following in the crypto market:
- The Winklevoss Twins: Cameron and Tyler Winklevoss, early Bitcoin adopters, embraced trend following to great success. Back in 2013, they started purchasing Bitcoin when its price was just $120 per coin. Despite enduring several ups and downs in the market, they held firm to their trend following approach and never lost sight of the long-term potential they saw in cryptocurrencies. Eventually, this decision paid off tremendously as Bitcoin surged to new heights, reaching an all-time high of around $65,000 per coin by 2021.
- The Ark Investment Management: Under the guidance of Cathie Wood, a leading figure in the world of investment management, Ark Investment has garnered attention for its successful application of trend following strategies in the crypto market. By identifying promising trends and investing in related assets or companies, Ark has experienced remarkable growth. Their accurate predictions regarding the rise of cryptocurrencies like Bitcoin and altcoins have led to substantial financial gains, solidifying their status as a notable player in the industry.
- Barry Silbert’s Digital Currency Group: Barry Silbert’s Digital Currency Group (DCG) is renowned for its expertise in spotting promising trends within the crypto market. DCG serves as an umbrella for various subsidiary companies related to digital currencies, including Grayscale Investments. Through adopting a trend-following approach over many years, DCG witnessed considerable success with their portfolio strategy focused on Bitcoin and other digital assets.
- Anthony Di Iorio: Recognized as one of Ethereum’s co-founders, Anthony Di Iorio managed to capitalize on well-timed trend following decisions. His involvement in the crypto space began when he discovered Bitcoin early on and later recognized the potential of Ethereum. Di Iorio pledged financial backing to these projects at opportune moments, taking full advantage of emerging crypto trends. As a result, he amassed a substantial fortune and played a significant role in the growth and development of the cryptocurrency industry.
- Paul Tudor Jones: While primarily known as a renowned hedge fund manager, Paul Tudor Jones became involved in the crypto space more recently. In 2020, Jones publicly expressed his belief that Bitcoin was an attractive investment due to its store-of-value qualities and potential for capital appreciation. By adopting a trend following strategy, Jones diversified his investment portfolio into Bitcoin futures contracts, ultimately benefitting from the subsequent surge in Bitcoin’s price. His success further validated the trend following approach within the crypto market.
These real-life success stories underscore the significance of trend following in the realm of cryptocurrency trading and investment. From early adopters to seasoned investors, these individuals have embraced trends within the market with insightful strategies, leading to substantial financial gains. It serves as a reminder that being observant, adaptable, and forward-thinking can create opportunities for remarkable success in the dynamic world of crypto markets.
Common Mistakes To Avoid in Crypto Trend Following
When it comes to trend following in the crypto market, several common mistakes can hinder your success. These pitfalls are often encountered by both beginners and experienced traders alike. Understanding and avoiding these mistakes is crucial for achieving profitable outcomes in this volatile industry. Here are some of the most noteworthy errors to steer clear of when trend following in the crypto world:
- Chasing every trend:
It’s easy to get caught up in the excitement of various trends and FOMO (fear of missing out) can cloud rational decision-making. However, blindly chasing every trend that emerges without conducting proper research and analysis can lead to false signals and losses. - Ignoring fundamental analysis:
While trend following primarily focuses on price movements, neglecting fundamental analysis can be a grave mistake. Understanding the underlying value and market sentiment is crucial for evaluating the sustainability and potential of a cryptocurrency’s upward or downward trend. - Not using risk management techniques:
Proper risk management is vital for any successful trader, yet many individuals overlook it when trend following in the crypto market. Not setting stop-loss orders, failing to limit trade sizes, or not incorporating appropriate diversification strategies can lead to substantial financial losses. - Emotions driving decisions:
Emotions have no place when it comes to executing trades based on trends. Fear and greed can often lead to impulsive decisions and prevent traders from sticking to their predetermined strategies. Keeping emotions in check and having a disciplined trading plan are key to avoiding emotional trading mistakes. - Falling victim to confirmation bias:
Confirmation bias occurs when traders solely focus on information supporting their preconceived notions or biases, while conveniently ignoring conflicting data. To make sound decisions while trend following, it is essential to diligently consider all perspectives and impartially assess market trends. - Neglecting money management principles:
Properly managing your capital is imperative in any trading venture, including crypto trend following. Many traders fail to allocate capital effectively, overtrading, risking excessive amounts on a single position, or not employing appropriate position sizing techniques. Ignoring these principles can quickly deplete your funds. - Relying solely on historical trends:
Historical trends can provide insightful information, but exclusively relying on them for decision-making fails to account for the ever-changing market dynamics and specific circumstances. Understanding the current market conditions and incorporating real-time data is essential for making informed choices. - Lack of continuous learning:
The crypto market is highly dynamic and requires traders to stay updated with new developments, regulatory changes, and technological advancements. Failing to continually expand your knowledge and keep pace with the industry’s evolution can lead to missing out on important insights or trends.
Trend following in the crypto market can be both exciting and profitable. However, sidestepping these common mistakes is crucial for achieving long-term success. By being cautious, disciplined, and consistently refining your trading skills and strategies, you increase your chances of effectively riding crypto trends and maximizing your profits.
How To Combine Fundamental Analysis with Trend Following Strategies
Combining fundamental analysis with trend following strategies can provide a comprehensive approach to trading in the crypto market. By taking into account both fundamental aspects and technical trends, traders can make more informed decisions and improve their chances of success. Here are some key points to consider:
Fundamental Analysis:
- Fundamental analysis involves evaluating the intrinsic value and underlying factors of an asset. In the crypto market, it typically includes assessing the project’s team, technology, partnerships, adoption, market competition, and regulatory environment.
- By understanding the fundamentals, traders can gain insight into whether a cryptocurrency has long-term value, potential for growth and profitability, or possible risks and limitations.
- News events, project updates, research reports, and public sentiment can significantly impact the price and overall market sentiment for cryptocurrencies.
- Fundamental analysis helps identify deviations from intrinsic value that may present buying or selling opportunities.
Trend Following strategies:
- Trend following strategies focus on identifying and capitalizing on market trends. Traders aim to profit from both upward and downward price movements by entering or exiting positions based on trend signals.
- These strategies rely on technical indicators such as moving averages, trend lines, and price patterns to identify and confirm trends.
- When using trend following strategies, it is crucial to define entry points, exit points, position sizes, and risk management rules in advance.
- Trends can have varying timeframes – short-term (hours or days), medium-term (weeks or months), or long-term (months or years). Traders need to identify the relevant timeframe for their strategy.
- Trend followers generally stay in a position until there is a clear reversal or a predefined exit criterion is met.
Combining fundamental analysis with trend following:
- By incorporating fundamental analysis into trend following strategies, traders can gain valuable insights regarding which cryptocurrencies are worth considering based on their underlying potential.
- Fundamental factors can help determine which cryptocurrencies are likely to experience significant price movements due to positive news events or changes in market sentiment.
- Traders can use technical indicators to time their entries and exits within a trend, enhancing profitability by aligning with the overall market momentum.
- While practicing trend following, being aware of upcoming fundamental developments can serve as a risk management tool. Traders can adjust their positions or exit trades before significant news is released.
- Implementing a combination of fundamental analysis and trend following strategies can cater to both short-term profit-taking opportunities and long-term investment potential.
Remember, market conditions and individual cryptocurrencies can vary significantly, so traders must continually adapt their strategies and stay updated with the latest news and trends. Ultimately, combining fundamental analysis with trend following provides a more holistic approach to navigating the dynamic crypto market efficiently.
Diversification Across Cryptocurrencies: A Strategy for Trend Followers
Diversification Across Cryptocurrencies: A Strategy for Trend Followers
When it comes to investing in the volatile and ever-changing crypto market, diversification is a key strategy for trend followers. Unlike traditional markets where diversification may involve holding a mix of stocks, bonds, or real estate, diversifying across cryptocurrencies allows investors to spread their risk while potentially benefiting from multiple sources of growth.
So what exactly is diversification when it comes to cryptocurrencies? In simple terms, it involves investing in a variety of different cryptocurrencies rather than focusing on just one. By doing so, investors can capitalize on various market trends and reduce the impact of potential losses from any single coin.
One of the main advantages of diversification in the crypto market is its potential to maximize returns. It allows investors to participate in profitable trends that may occur across different cryptocurrencies simultaneously. For example, while Bitcoin may be experiencing a decline in value, Ethereum could be on an upswing. By having exposure to both, an investor can potentially offset the losses in Bitcoin with gains from Ethereum.
Furthermore, diversification helps protect against increased volatility. Cryptocurrencies are known for their rapid price swings and unpredictability. By spreading investments across different coins, investors can potentially lessen the impact of sudden price drops or market crashes that may affect individual digital assets.
However, it is crucial to remember that diversification does not guarantee profits or protect against all potential losses. It is important for investors to conduct thorough research before choosing which cryptocurrencies to include in their portfolio. Some factors to consider include analyzing the project behind each cryptocurrency, evaluating its team and development progress, and investigating its potential real-world applications.
In addition to selecting an array of cryptocurrencies, implementing proper portfolio management techniques is essential for effective diversification. Regularly rebalancing holdings, adjusting allocation percentages based on performance and market conditions,
can help maintain a well-diversified portfolio over time.
It’s important to keep in mind that crypto market conditions can change rapidly, trends can sometimes reverse, and the numerous factors impacting individual cryptocurrencies vary greatly. Regularly reviewing and adjusting your diverse crypto portfolio based on market performance and new information is necessary for staying ahead.
In conclusion, diversification across cryptocurrencies presents an opportunity for trend followers in the ever-evolving world of digital assets. By investing in multiple cryptocurrencies, investors aim to enhance returns and reduce risk by taking advantage of various market trends. However, detailed research and ongoing portfolio management are crucial to navigate this dynamic landscape successfully.
Algorithmic Trading and Bot-Assisted Trend Following in Crypto Markets
Algorithmic Trading:
Algorithmic trading, also referred to as algo-trading or automatic trading, is a strategy wherein pre-programmed computer algorithms are used to execute trades on financial markets, including the crypto market. These complex algorithms analyze vast amounts of quantitative data and execute trades based on predefined rules or patterns. The goal of algorithmic trading is to maximize efficiency, reduce human error, increase the speed of executing trades, and ultimately generate profits by taking advantage of market opportunities.
One of the key advantages of algorithmic trading is its ability to execute trades much faster than humans ever could. This speed is essential as crypto markets can be highly volatile, and even slight delays could result in missed opportunities or losses. Algorithms can react instantly to specific market conditions and execute large volumes of trades without any manual intervention.
Bot-Assisted Trend Following in Crypto Markets:
Bot-assisted trend following is a popular strategy utilized by traders in the crypto markets. Here, bots or algorithms are employed to track and follow trends in the market to identify potential opportunities for generating profits.
In bot-assisted trend following, these automated systems analyze historical price data, technical indicators, and any other relevant factors that may indicate changes in market trends. They often employ various mathematical models and statistical analysis techniques to predict future price movements.
Traders who utilize this approach aim to capitalize on the momentum generated by trends identified by the bots. If an upward trend is identified, they will buy cryptocurrencies with the expectation of selling them at a higher price later. Conversely, if a downward trend is detected, they may either sell short or avoid entering into new positions until more favorable conditions arise.
By utilizing automated systems like bots for trend following, traders can potentially remove emotional bias from their decision-making process and rely on objective indicators instead. These bots can continuously monitor the volatile nature of cryptocurrency markets, which are prone to quick reversals and unexpected trends.
It’s worth noting that while bot-assisted trend following can offer advantages, it is not foolproof, and there are always risks involved. Cryptocurrency markets can be highly unpredictable, susceptible to sudden shifts, and influenced by various external factors. Traders employing this strategy must regularly assess and refine their algorithms to adapt to changing market conditions.
Overall, algorithmic trading and bot-assisted trend following have become increasingly prevalent in the crypto market. These strategies provide traders with the potential to execute trades more efficiently, react swiftly to market changes, and maximize opportunities for generating profits – all with the assistance of automated systems that analyze vast amounts of data in real-time.
Evaluating the Performance of Your Trend Following Strategy
Evaluating the Performance of Your Trend Following Strategy
Evaluating the performance of your trend following strategy is essential to determine its effectiveness and examine whether it aligns with your investment goals. Here are some key aspects to consider when evaluating the performance of your trend-following strategy:
- Define clear objectives: Before assessing strategy performance, it’s important to establish clear objectives. Determine your investment goals, risk tolerance, and time horizon. This will help you understand how the strategy aligns with your overall trading plan.
- Gather comprehensive data: To evaluate the performance accurately, gather comprehensive trading data including trade entries, exits, duration, positions, and profitability. Analyzing this data will allow you to assess various aspects such as win rate, average gain/loss, drawdowns, risk-reward ratios, and other relevant metrics.
- Review trend identification: Assess how accurately your strategy identifies trends in the market. Consider whether it captures both upward and downward trends effectively or if it tends to generate false signals or lag behind major market moves.
- Measure risk management strategies: Evaluate how well your trend following strategy manages risks. This includes examining position sizing, stop-loss or exit strategies for adverse situations, trailing stops, and overall risk exposure in different market conditions.
- Study risk-adjusted returns: Merely considering profitability might not present a complete picture of a strategy’s performance. Calculate risk-adjusted metrics such as Sharpe ratio or Sortino ratio that consider the level of risk taken to produce those returns. These measures help determine a strategy’s efficiency in generating returns relative to the level of volatility or downside risk.
- Assess consistency: Evaluate if your trend-following strategy produces consistent results over different time frames and market conditions. Determine if it remains profitable during trending markets as well as range-bound or volatile periods.
- Compare against benchmarks: Benchmark your strategy’s performance against relevant indices or established benchmarks in the cryptocurrency market. This comparison helps you gauge if the strategy outperforms or underperforms standardized measures.
- Consider equity curves: Plot an equity curve to visualize the fluctuations and performance of your trend-following strategy over time. Analyzing this curve will provide insights into how the approach is performing, and if there are any notable periods of drawdown or prolonged underperformance.
- Constantly review and adapt: Regularly assess and adjust your trend following strategy based on the evaluation outcomes. Revise factors such as position sizing, indicators, risk management techniques, or timeframe settings to enhance its overall performance.
- Seek professional guidance: If you lack experience or expertise in evaluating strategy performance, consider consulting with professionals in the field of cryptocurrency trading or seek guidance from experienced traders who specialize in trend following strategies.
Evaluating your trend following strategy’s performance is an ongoing process that requires diligent analysis, adaptation, and learning from both successes and failures. By systematically evaluating your strategy, you can refine it over time to improve its profitability and align it better with your investment objectives in the ever-changing crypto market landscape.
Legal and Regulatory Considerations for Crypto Trend Traders

When engaging in crypto trend trading, it is crucial to acknowledge a range of legal and regulatory considerations that may impact your activities. Cryptocurrencies operate within a rapidly evolving legal landscape, subject to different regulations worldwide. Here are some insights and key points regarding legal and regulatory aspects for crypto trend traders.
One important aspect to bear in mind is licensing and registration requirements. Jurisdictions around the world have varied stances on the licensure of cryptocurrency exchanges or trading platforms. Some countries mandate obtaining specific licenses or registrations to engage in crypto trading activities. Before participating in trend trading, ensure you are aware of any prerequisites enforced by your local regulatory authorities.
Cryptocurrency taxation is another significant consideration. Profits derived from buying or selling cryptocurrencies may be subject to taxation depending on your jurisdiction. The tax regulation on cryptocurrencies generally varies significantly among different countries and even within separate regions of particular nations. Be aware of your tax obligations to avoid any potential violations.
Compliance with anti-money laundering (AML) and know-your-customer (KYC) regulations should also be prioritized when conducting trend trading. Many countries demand cryptocurrency exchanges or other institutions in the crypto space to implement rigorous AML and KYC procedures to prevent illicit activities, such as money laundering or terrorist financing. Familiarize yourself with the requirements established by relevant authorities in your region.
The legal status of cryptocurrencies themselves differs across jurisdictions. While some governments consider cryptocurrencies legal tender, others classify them as digital assets, commodities, or financial instruments. It’s important to understand how your local legal system defines cryptocurrencies and their associated implications. New laws and regulations continue emerging; therefore, traders should stay updated with relevant legal developments.
Furthermore, initial coin offerings (ICOs) also come under regulatory scrutiny in various jurisdictions. ICOs involve raising funds through the sale of tokens, which can attract securities or fundraising regulations. Understanding applicable ICO regulations in your country can safeguard you from legal complications when trading tokens issued through such offerings.
Cryptocurrency market manipulation is yet another area of concern. Many jurisdictions have enforcement mechanisms to combat manipulative practices, including pump and dump schemes or insider trading. Engaging in unfair trading practices can lead to significant legal consequences. Be conscious of any market manipulation regulations that may apply to your crypto trend trading activities.
Cross-border transactions are becoming increasingly regulated in the cryptocurrency arena. Some jurisdictions require compliance with foreign exchange control laws for international cryptocurrency transfers, imposing specific reporting obligations and restrictions. Always be aware of potential limitations or legislations when conducting cross-border transactions involving cryptocurrencies.
Legal considerations specific to decentralized finance (DeFi) should also be taken into account. DeFi projects may involve smart contracts, lending protocols, decentralized exchanges, and more. As these technologies evolve, regulative approaches are sure to follow suit, posing various legal implications that traders must grasp to navigate the DeFi landscape compliantly.
In summary, when engaging in crypto trend trading, understanding the legal and regulatory framework becomes paramount. Licensing requirements, tax obligations, AML/KYC compliance, classifications of cryptocurrencies, ICO regulations, market manipulation laws, cross-border transaction restrictions, and evolving DeFi regulations are among the key factors to consider. Adhering to the legalities will help ensure your trading activities remain within the bounds of legality and mitigate the risks associated with unregulated or non-compliant practices.
Future Outlook: What’s Next for Trend Following Strategies in Cryptocurrencies?

Trend Following Strategies have been indubitably popular in the cryptocurrency market, enabling traders to identify and act upon emerging trends in prices. As the crypto market continues to evolve, it becomes crucial to analyze and speculate on the future outlook of these strategies. So, what lies ahead for trend following strategies in cryptocurrencies?
First and foremost, it is important to acknowledge that trend following as a strategy has delivered consistent results over time. This strong track record suggests that it will remain relevant in the future as well. Cryptocurrencies are known for their volatility, characterized by sharp price fluctuations. Thus, trend following strategies can help traders capture significant profits during both upward and downward trends in this highly dynamic market.
Moreover, with the increasing institutional participation and maturation of the crypto market, trend following strategies are likely to gain more recognition. Institutional investors bring a different perspective to the table with their quantitative models and automated trading systems, making use of these strategies on a larger scale. This influx of professional investors will contribute to further liquidity and efficiency in the market, bolstering the effectiveness of trend following.
Furthermore, advancements in technology and access to vast amounts of historical data can potentially enhance trend following strategies. Artificial intelligence (AI) and machine learning capabilities have made significant progress in recent years. These technologies can be implemented to process massive amounts of crypto market data swiftly, identifying key patterns and trends that might have been overlooked previously. Such applications can lead to improved insights and better decision-making for trend followers.
In terms of challenges for trend following strategies in cryptocurrencies, regulatory factors should not be ignored. The evolving regulatory landscape, particularly pertaining to cryptocurrencies, may impact these strategies as new rules are introduced. Therefore, it becomes necessary for traders employing trend following approaches to adapt and adhere to changing regulations accordingly.
Alongside regulatory concerns, critics argue that widespread adoption of cryptocurrencies may stabilize the market, potentially hampering the effectiveness of trend following strategies centered around price volatility. However, the crypto market still remains a relatively nascent market with ample room for growth and fluctuation. Thus, it is crucial to monitor how the landscape progresses to evaluate the long-term viability of trend following strategies.
In summary, while no one can predict the future with absolute certainty, trend following strategies are likely to endure as valuable tools in navigating the complex cryptocurrency market. Continual advancements in technology, increased institutional involvement, and refined data-driven techniques will contribute to their continued relevance. However, attentiveness to regulatory changes and the potential impact of market stabilization should also be considered. Understanding these factors gives traders and investors a valuable perspective on what lies ahead for trend following strategies in cryptocurrencies.
Candlestick Patterns and their Significance
Understanding the Basics of Candlestick Patterns in the Crypto Market
Candlestick patterns serve as powerful tools for understanding the dynamics of the crypto market. By comprehending these patterns, traders gain insights into bullish or bearish sentiments and can make more informed decisions. Here is an overview of the basics of candlestick patterns in the crypto market.
At a fundamental level, a candlestick represents the price movement of an asset within a specific timeframe, be it hours, days, or months. Each candlestick consists of four main parts: the open, close, high, and low.
Firstly, the body of the candlestick portrays the opening and closing prices during the designated time period. If the closing price is higher than the opening price, the body is typically colored green or white to indicate a bullish pattern. Conversely, if the closing price is lower than the opening price, the body is usually red or black to signify a bearish pattern.
The upper shadow (also known as wick or upper wick) extends above the body and illustrates the highest price reached during that timeframe. On the other hand, the lower shadow (or lower wick) represents the lowest price achieved. Analyzing these shadows helps discern market sentiment.
Different candlestick patterns convey distinct insights into market trends. The simplest pattern, known as a doji candlestick, occurs when the open and close prices are very similar. This shape indicates market indecision and equivocal supply-demand dynamics.
Additional notable patterns include engulfing candles where one candle “engulfs” or overtakes the previous one, signaling potential reversals; hammers displaying long shadows with small bodies, indicating selling pressure losing momentum; shooting stars embodying an inverted hammer-like structure pointing towards possible downturns in bullish trends; and spinning tops characterized by small bodies and long shadows that imply uncertainty.
To appropriately interpret these patterns, traders often refer to other technical analysis tools like volume indicators or moving averages for confirmation. Volume analysis helps assess market strength or weakness, while moving averages enable traders to track price trends and potential directional shifts.
In conclusion, understanding candlestick patterns is crucial in the analysis of the crypto market. These formations provide insights into bullish or bearish sentiments, occurrences of indecision, and potential trend reversals. By incorporating candlestick patterns into their trading strategies, traders have a better chance of making sound decisions based on market dynamics and increasing their chances for profitability.
The Significance of Bullish and Bearish Candlestick Patterns for Crypto Investors

The significance of bullish and bearish candlestick patterns cannot be overlooked when it comes to analyzing the crypto market for investors. These patterns provide valuable insights into market sentiment and potential price movements, helping investors make informed decisions about buying or selling cryptocurrencies.
Bullish candlestick patterns indicate periods of optimism and upward momentum in the market. During bullish trends, these patterns serve as confirmation of a potential continuation of an uptrend. Common bullish candlestick patterns include the hammer, engulfing pattern, morning star, and ascending triangle.
The hammer is characterized by a small body near the top of the candle’s range with a long lower wick. It suggests that sellers were overpowered by buyers, hinting at a potential reversal or continuation of an uptrend.
The engulfing pattern occurs when a smaller bearish candlestick is followed by a larger bullish candlestick that engulfs it completely. This signals a shift in control from sellers to buyers, indicating a potential trend reversal.
Morning star formation involves three consecutive candles, starting with a bearish candle, followed by a small-bodied candle (doji or spinning top), and finally a strong bullish candle. This pattern signifies bullish reversal momentum and gives investors insight into a market shift towards an upward trend.
In ascending triangles, there is a rising lower trendline and a flat upper line. This pattern typically suggests accumulation and indicates that the cryptocurrency may break out further upwards.
On the other side of the spectrum, bearish candlestick patterns signify pessimism and downward pressure in the market. They indicate a potential reversal or continuation of a downtrend. Various bearish patterns include shooting star, hanging man, bearish engulfing, and the descending triangle.
A shooting star has a small body located near the bottom of the range with a long upper wick. It suggests an exhaustion point where sellers outweigh buyers and might anticipate price reversals before continuing downward.
A hanging man bears resemblance to the shooting star, but it occurs during an uptrend and signifies potential trend reversals. The small body is positioned near the top of the range, portraying bearish pressure that may lead to a downward move.
Bearish engulfing takes place when a smaller bullish candlestick is immediately followed by a larger bearish candlestick that engulfs it completely. A bearish reversal signification arises as sellers overcome buyers during this pattern.
Descending triangles exhibit a declining upper trendline and a flat lower one. The pattern represents distribution tendencies, hinting towards potential further downward breakout.
By observing these candlestick patterns, investors can effectively gauge market sentiment and identify potential entry or exit points in cryptocurrencies. Combining these patterns with other technical analysis tools enhances the predictability of market trends, enabling crypto investors to make sound investment decisions.
Remember, thorough examination of overall market conditions and utilizing additional indicators is crucial for successful trading within the unpredictable world of cryptocurrencies.
Candlestick Patterns: Decoding Market Sentiments in Cryptocurrency Trading
Candlestick patterns are popular analytical tools in cryptocurrency trading that help traders better understand market sentiments and predict future price movements. These patterns are formed by the combination of multiple candlesticks, each representing a specific time period and conveying valuable information about the asset being traded.
There are various types of candlestick patterns, each with its own distinct characteristics and implications. The most common ones include:
- Bullish Engulfing: This pattern occurs when a small bearish candle is followed by a large bullish candle that engulfs the previous one. It often indicates a potential trend reversal from a bearish to a bullish sentiment.
- Bearish Engulfing: The exact opposite of the bullish engulfing pattern, it happens when a small bullish candle is overshadowed by a larger bearish candle. Traders interpret this as a possible shift from a bullish to a bearish market sentiment.
- Doji: A doji candlestick has equal or almost equal opening and closing prices and consolidates within a small range. This pattern typically represents market indecision, suggesting uncertainty and potential trend reversals.
- Hammer: Often seen at the bottom of downtrends, a hammer candle has a small body and a long lower wick (shadow). It is viewed as a bullish indication, signaling that bears could be losing control and prices may recover.
- Shooting Star: Similar to the hammer but occurring at the top of uptrends, the shooting star boasts a long upper shadow, indicating potential bearishness going forward.
- Morning Star: Consisting of three candles, with the middle one being smaller and positioned lower than the other two, the morning star displays potential bullish signals as it suggests an upcoming trend reversal from bearishness to bullishness.
- Evening Star: The opposite of the morning star, this pattern signifies market sentiment shifting from bullish to bearish. It consists of three candles like its counterpart but with the middle one smaller and positioned higher.
Traders use these candlestick patterns, among others, along with additional technical analysis tools and indicators to make informed decisions in cryptocurrency trading. By interpreting the sentiment indications provided by each pattern, traders can anticipate potential market movements and devise effective trading strategies accordingly.
How to Trade Crypto Using Doji Candlestick Patterns for Better Decision Making

Cryptocurrencies have gained immense popularity in recent years, attracting a diverse range of investors and traders. Understanding how to analyze price movements and make informed decisions is crucial in the volatile crypto market.
One widely used technical analysis tool is candlestick patterns, which provide valuable insights into price trends. Among these patterns, the Doji candlestick pattern holds particular relevance for crypto traders. The Doji pattern depicts a situation in which an asset’s opening and closing prices are nearly identical or often converge.
Trading crypto using Doji candlestick patterns can improve decision-making by helping traders identify potential reversals, trends, and market indecision. By correctly interpreting the meaning behind Doji candles, traders can make more strategic and profitable moves.
There are several types of Doji candlestick patterns that traders should understand:
- Long-legged Doji: This candle has long upper and lower shadows, suggesting high levels of indecision in the market. It denotes equilibrium between buyers and sellers, signaling a potential reversal or trend continuation.
- Dragonfly Doji: The Dragonfly Doji has a long lower shadow with little to no body visible. It suggests a bearish trend may be ending or reversing, indicating a possible buy signal.
- Gravestone Doji: Conversely, the Gravestone Doji features a long upper shadow with little to no body visible. It appears during an uptrend and indicates that the trend might reverse soon. Traders often interpret it as a potential sell signal.
- Four-Price Doji: This rare candlestick occurs when the open, close, high, and low prices are almost equal. It implies extreme market indecision or consolidation and might indicate that a break-out or reversal is imminent.
To effectively trade using Doji candlestick patterns, traders need to consider other factors alongside these patterns. Paying attention to volume levels, trendlines, support and resistance levels, as well as other technical indicators, can complement the analysis and decision-making process. Combining these tools allows traders to better assess the probability of a certain price movement.
Remember, candlestick patterns form only a part of technical analysis. They provide insights into potential future price action but should not be considered as stand-alone indicators. A careful balance between multiple analysis techniques is key to successful trading in the crypto market.
As with any market, strict money management rules and risk assessment are crucial. Documenting trades, staying updated with crypto news, and keeping emotions in check optimize sound decision-making and enhance overall trading performance.
By understanding and effectively utilizing the various Doji candlestick patterns, crypto traders can significantly improve their ability to make informed decisions and ultimately navigate the exciting yet volatile crypto market with more confidence.
The Role of Hammer Candlesticks in Identifying Potential Reversals in Crypto Markets
The Role of Hammer Candlesticks in Identifying Potential Reversals in Crypto Markets
When it comes to technical analysis in the crypto market, candlestick patterns play a crucial role in recognizing potential reversals and forecasting price movements. One prominent candlestick pattern that traders often rely on is the hammer, also known as a hammer candlestick.
A hammer candlestick is a single candlestick pattern with a small body and a long lower shadow. To identify a hammer, you need to spot a candlestick with a small real body located at the upper end of the trading range with a long lower shadow extending towards the bottom. This formation essentially looks like a hammer ready to strike.
The significance of hammer candlesticks lies in their ability to indicate potential trend changes or price reversals. A hammer implies that selling pressure pushed the price down during the session, but momentum shifted, leading to a recovery and closing near or above the opening price. This change in momentum can signal that buyers are stepping in and potentially outweighing sellers.
Due to its shape, the hammer suggests that bullish sentiment is prevailing in the market. Its small real body represents consolidation and indecision regarding price direction. The long lower shadow forming below the body indicates that bears attempted to push prices lower, but buyers were able to reject these attempts and bring the price back up.
In crypto markets specifically, where volatile swings are common, hammer candlesticks can be especially useful for identifying potential market reversals. Traders often interpret this pattern as an early sign of an upward movement following a downtrend or as an indication of support levels being reached.
However, it’s important not to solely rely on the presence of a hammer candlestick for confirming reversals. Ideally, traders should consider other factors such as volume, overall trend analysis, and confirmation from other technical indicators before making any trading decisions based on candlestick patterns alone.
To sum up, hammer candlesticks play an essential role in identifying possible trend reversals in crypto markets. They suggest that buyers have gained strength and could potentially overpower sellers, leading to a potential price increase. However, it is vital to consider other supporting factors to increase the probability of accurate predictions.
Engulfing Candlestick Patterns and Their Predictive Value for Crypto Traders
Engulfing candlestick patterns are widely used by technical analysts in the world of cryptocurrency trading. These visual patterns on candlestick charts can provide valuable insights and predictions regarding future price movements. To understand the predictive value of engulfing candlestick patterns, it is crucial to comprehend their formation and different types.
An engulfing pattern materializes when a smaller candle is completely engulfed by the larger one that follows directly. This specific formation symbolizes a significant shift in market sentiment. There are two variations of engulfing patterns: bullish and bearish engulfs.
Bullish Engulfing Pattern:
A bullish engulfing candle occurs when a relatively small bearish candle is entirely covered by a subsequent larger bullish one. This formation suggests that market sentiment has shifted from bearish to bullish in the given timeframe. Consequently, this pattern often indicates a potential upward price reversal or trend continuation.
The presence of a bullish engulfing pattern could be viewed as a buy signal for many crypto traders since it shows the potential for an upcoming price appreciation. However, it is important to consider other factors such as volume, market conditions, and confirmation from additional technical indicators before making trading decisions based solely on this pattern.
Bearish Engulfing Pattern:
On the other hand, a bearish engulfing pattern occurs when a small bullish candle is subsequently engulfed by a larger bearish one. This formation implies a shift from bullish sentiment to bearish within the specified timeframe. It usually indicates that selling pressure has increased and could potentially lead to a downward trend or reversal.
Crypto traders may interpret the presence of a bearish engulfing pattern as a sell signal, considering that it suggests an imminent price decline. However, it is crucial to analyze other aspects alongside this pattern, including volume, support/resistance levels, and other relevant technical indicators before executing trades based solely on this formation.
Predictive Value for Crypto Traders:
Engulfing candlestick patterns hold valuable predictive significance in the ever-fluctuating crypto market. They can assist traders in identifying potential trend reversals or continuations, marking entry/exit points, and managing risk more effectively.
Nevertheless, it is important to remember that engulfing patterns should not be relied upon as standalone indicators. To enhance the accuracy and reliability of predictions, it is advisable to complement engulfing patterns with other technical analysis tools such as trendlines, moving averages, oscillators, and support/resistance levels.
Trading decisions should always consider multiple factors and indicators for a comprehensive analysis. Engulfing patterns can serve as a valuable component of a trader’s strategy but should be used in conjunction with other analyses and risk management measures aimed at reducing potential losses and maximizing profitability.
Morning Star vs. Evening Star: What These Candlestick Patterns Spell for Cryptocurrencies
Morning Star and Evening Star are two candlestick patterns that can provide insights into the future direction of cryptocurrencies. These patterns are widely used by traders and technical analysts to make informed decisions. Let’s delve deeper into what these patterns spell for cryptocurrencies.
The Morning Star is a bullish reversal pattern consisting of three candles. The first candle is a long red (or bearish) candle that clearly indicates a downtrend. The second candle is shorter in length and demonstrates indecision in the market. This candle can be either bullish or bearish, but it typically has a smaller body. Finally, the third candle is a long green (or bullish) candle, signaling a bullish reversal. It signifies that buyers have gained control and are pushing the price higher.
When spotting a Morning Star pattern in the crypto market, it suggests that a trend reversal from bearish to bullish is imminent. However, using this pattern alone may not be sufficient. Traders often look for confirmation from other indicators or trends to strengthen their conviction before initiating any trade.
On the flip side, we have the Evening Star pattern, which is a bearish reversal pattern. It also consists of three candles, but this time, it indicates a potential shift from bullish to bearish. The first candle in an Evening Star formation is usually a long green (or bullish) candle that confirms an ongoing uptrend. The second candle represents uncertainty and can be either bullish or bearish with a small body. Finally, the third candle brings the confirmation of a reversal; it is a long red (or bearish) candle indicating that selling pressure has overcome buying pressure.
Spotting an Evening Star formation in the crypto market suggests that it might be a good time to exit long positions or even consider short selling if there are further technical or fundamental signals aligning with this pattern.
It should be noted that these patterns often occur during periods of price consolidation or when significant events impact the market sentiment. Traders use candlestick patterns like Morning Star and Evening Star as part of their broader analysis to gain an edge in predicting future price movements. Their effectiveness can vary across different cryptocurrencies and market conditions, hence it is imperative to consider additional tools, indicators, and information before making any trading decisions.
By identifying Morning Star or Evening Star patterns in the crypto market, traders can potentially benefit by recognizing potential trend reversals and planning their trades accordingly.
Utilizing the Harami Candlestick Pattern to Enhance Your Crypto Trading Strategy
Utilizing the Harami candlestick pattern can be a valuable tool to enhance your crypto trading strategy. This classic chart pattern helps traders identify potential trend reversals and ascertain favorable trade opportunities. Comprehending the Harami pattern and its significance can provide insights into market sentiment, giving traders an edge in making informed decisions.
The Harami pattern consists of two candles, with the first candle being larger and the second one smaller in size. These candles have different colored bodies, indicating an alteration in buyer and seller dominance. The first candle’s size, relative to previous candles, signifies its importance.
When analyzing the Harami pattern, it is crucial to understand its variations. A bullish harami occurs when the first candle showcases a downtrend (bearish) but is followed by a smaller candle (bullish) within its range. This indicates a potential trend reversal from bearish to bullish. On the contrary, a bearish harami transpires when the first candle reflects an ascending trend (bullish), only to be followed by a smaller candle (bearish) inside its range. This suggests a possible reversal from bullish to bearish.
Traders typically work with additional validation tools or indicators while utilizing the Harami pattern. Analyzing the prevailing market conditions, considering price action around support and resistance levels, and implementing other technical indicators can help confirm the validity of the Harami pattern before initiating a trade.
Moreover, traders often pair the Harami pattern with other complementary strategies for enhanced effectiveness. Such combinations may include assessing key support or resistance levels alongside trendlines, moving averages, or utilizing momentum indicators such as MACD (Moving Average Convergence Divergence) or RSI (Relative Strength Index).
Recognizing the appearance of a Harami candlestick pattern on cryptocurrency price charts provides traders with valuable information for potential trading opportunities. Traders may implement this insight to identify potential entry or exit points for their trades, allowing them to capitalize on sudden price shifts and maximize profits.
While the Harami pattern can offer insights into market sentiment, good risk management is essential. It is vital to set stop-loss orders and establish clear profit targets to ensure a disciplined approach to trading. Careful consideration of market conditions, risk tolerance, and trade strategies remains integral to create a comprehensive crypto trading plan.
In summary, mastering the usage of the Harami candlestick pattern within your crypto trading strategy is beneficial for identifying potential trend reversals and evaluating favorable trading opportunities. Combining the Harami pattern with other indicators can enhance its effectiveness. Successful implementation involves continuously monitoring market conditions, applying risk management techniques, and adhering to strategic planning in order to make well-informed trading decisions.
The Psychology Behind Major Candlestick Patterns in Cryptocurrency Trading
Candlestick patterns play a significant role in understanding the psychology behind cryptocurrency trading. Traders utilize these patterns to identify potential price reversals, confirm trends, and make more informed trading decisions. Let’s delve into the psychology behind some major candlestick patterns commonly observed in crypto markets.
- Doji:
A Doji candlestick occurs when the opening and closing prices are almost equal, resulting in a cross-like or plus sign pattern. This suggests that buyers and sellers are at equilibrium, indicating indecision within the market. It reflects a battle between bears (sellers) and bulls (buyers), often signaling an impending trend change. - Hammer:
The hammer candlestick signifies a potential trend reversal after a downtrend. It displays a small body located at the upper end of the long lower shadow, resembling a hammer. This pattern suggests that buyers stepped in to push prices higher after a period of aggressive selling. It indicates market sentiment shifting from bearish to bullish. - Shooting Star:
Opposite to the hammer, the shooting star occurs after an uptrend and signals a possible trend reversal. The candlestick possesses a wick extending above a small body, representing seller dominance driving prices down despite the initial surge by the bulls. The shooting star indicates that buyers are losing momentum and sellers are gaining control. - Engulfing Pattern:
The engulfing pattern is formed when a candle engulfs the previous candle entirely or its body engulfs the body of the previous candle. A bullish engulfing pattern forms during a downtrend and suggests that buyers have confidence in reversing the trend. Conversely, a bearish engulfing pattern during an uptrend signifies that sellers are gaining control, potentially leading to a shift in market sentiment. - Evening Star:
The evening star pattern consists of three candles: a strong bullish candle followed by a small-bodied or Doji candle – signaling indecision – and finally, a strong bearish candle. It appears at the peak of an uptrend, suggesting a potential reversal. The evening star pattern reflects a transition from bullishness to bearishness, indicating selling pressure mounting amidst a weakening uptrend. - Morning Star:
Conversely, the morning star pattern emerges at the bottom of a downtrend, indicating a potential trend reversal. It also involves three candles: a strong bearish candle followed by a small-bodied or Doji candle, and finally, a strong bullish candle. It suggests that buying pressure is outweighing selling pressure, leading to optimism among traders.
Understanding these major candlestick patterns allows traders to gauge market sentiment and predict potential trend reversals accurately. By recognizing the psychological aspects marked by these patterns, traders can make informed decisions based on evolving buyer-seller dynamics within cryptocurrency markets.
Advanced Candlestick Patterns: Beyond the Basics for Seasoned Crypto Traders

Candlestick patterns are a popular tool used by seasoned crypto traders to analyze market trends and make informed trading decisions. While beginner traders often learn about basic candlestick patterns, there is a whole world of advanced candlestick patterns that can offer additional insights and enhance trading strategies. In this article, we will explore some of these advanced candlestick patterns that go beyond the basics.
- Marubozu
Marubozu candles occur when the opening price is the same as either the highest or lowest price of the day, with no upper or lower shadows. They indicate strong market sentiment and suggest that buyers or sellers completely dominated the trading session. If a bullish marubozu appears, it often indicates strong buying pressure and potential bullish continuation, while a bearish marubozu signals heavy selling pressure and bearish continuation. - Doji
A doji candlestick pattern forms when the opening and closing prices are very close or virtually the same. The hallmark of a doji is that it has almost no body, and the shadow lengths may vary. Dojis signify indecisiveness in the market and suggest a potential reversal or market consolidation. Traders often look for confirmation in the subsequent candles after spotting a doji. - Hammer
Hammers have small bodies located at the top end of a long lower shadow, resembling an inverted hammer. This pattern often signifies a potential trend reversal from bearish to bullish. Hammer candles indicate that buyers are stepping into the market after intense selling pressure, hinting at a possible trend shift. - Shooting Star
Shooting star patterns appear when prices open significantly higher than the previous close but rally during the session, ultimately closing near or below the opening price. They form at resistance levels and indicate potential reversals from bullish to bearish trends. When spotting a shooting star pattern, traders might look for confirmation through subsequent bearish candles. - Engulfing Patterns
Engulfing patterns are two-candlestick patterns that occur when a prior candle’s body fully engulfs the body of the preceding candle. Bullish engulfing patterns form a larger bullish candle after a smaller bearish one, suggesting strength in buying pressure. On the other hand, bearish engulfing patterns emerge when a larger bearish candle follows a smaller bullish one, implying an increase in selling activity and potential trend reversals. Engulfing candles often offer important signals, but traders should look for confirmation before acting on them. - Tweezer Tops and Bottoms
Tweezer tops form when two or more candles have almost the same high price, creating resistance levels. This pattern is considered bearish and suggests a possible trend reversal. On the other hand, tweezer bottoms are formed by identical or nearly identical lows, indicating support levels and potential upward price movements.
Remember that advanced candlestick patterns should not be solely relied upon for trading decisions. Often, it is recommended to combine them with other technical indicators and analysis to receive comprehensive trade signals. These advanced patterns can effectively compliment a trader’s repertoire, contribute to their market analysis, and enhance overall trading strategies in the exciting world of cryptocurrencies.
The Significance of Shooting Star and Inverted Hammer Patterns in Crypto Charts

The shooting star and inverted hammer patterns are significant candlestick formations on cryptocurrency charts. These patterns can provide insights to traders about potential shifts in price trends and help them make informed trading decisions.
The shooting star pattern is characterized by a small body and a long upper wick, with little to no lower wick. This formation appears at the end of an uptrend and suggests a possible trend reversal. It indicates that buyers pushed the price higher during the session but lost control, allowing sellers to push the price back down. This overall rejection of higher prices can be seen as a bearish signal by traders.
On the other hand, the inverted hammer pattern has a small body with a long lower wick, and little to no upper wick. This formation typically occurs at the bottom of a downtrend, suggesting a potential trend reversal to the upside. It indicates that buyers were able to push the price higher during the session, overpowering sellers temporarily. Traders interpret this as a bullish sign as it demonstrates that buying pressure is building up.
Both patterns are powerful signals when combined with other technical indicators or chart patterns, as they suggest potential reversals in market sentiment. However, it is essential to consider other factors such as volume, support/resistance levels, and overall market conditions before making any trading decisions solely based on these patterns.
In conclusion, understanding the significance of shooting star and inverted hammer patterns on crypto charts can greatly benefit traders seeking insights into possible trend reversals. These formations have the potential to provide valuable information when used in conjunction with other tools and should be considered within the broader context of market analysis.
Combining Multiple Candlestick Patterns for Increased Accuracy in Crypto Forecasting
Combining Multiple Candlestick Patterns for Increased Accuracy in Crypto Forecasting
When it comes to increasing accuracy in predicting crypto market trends, analyzing candlestick patterns plays a crucial role. However, relying on a single pattern might not provide the most accurate insights. That’s where combining multiple candlestick patterns can offer a more comprehensive and effective approach in crypto forecasting.
By assessing multiple candlestick patterns together, traders and analysts have the opportunity to gain deeper insights into market dynamics and price movements. This methodology involves examining consecutive and overlapping candlestick formations to identify patterns that occur across the charts.
One commonly used technique is to look for confirmation between different patterns. For instance, if a bullish reversal pattern like a hammer or bullish engulfing occurs concurrently with a trendline break, it may strengthen the signal for an upward trend continuation. The alignment of multiple patterns increases the likelihood of an accurate prediction by corroborating each other’s indications.
Additionally, combining candlestick pattern analysis with other technical indicators can enhance forecasting accuracy even further. Traders may utilize indicators such as moving averages, relative strength index (RSI), or volume analysis in conjunction with candlesticks to validate or strengthen their predictions.
Multiple candlestick patterns can also provide valuable information about trend reversals and trend continuation situations. By observing potential combination scenarios like the confirmation of bearish reversal patterns along with specific trendline breakages, traders can anticipate a possible trend reversal effectively.
It’s crucial to bear in mind that interpreting multiple candlestick patterns requires experience and expertise. Patience and thorough analysis are necessary since false signals can still occur, even when combinations seem favorable. Successful use of this strategy is based on continuously refining observation skills through practice with live market data.
Moreover, it is essential to keep track of timeframes while employing this technique. Different timeframes might reveal diverging or conflicting patterns, so examining multiple timeframes ensures a broader perspective on price movements and confirms the accuracy of identified combined patterns.
In conclusion, combining multiple candlestick patterns can significantly enhance the accuracy of crypto forecasting. By utilizing a holistic approach that encompasses confirmation between different patterns and integration with technical indicators, traders and analysts have a better chance of making informed decisions. Engaging in continuous learning and practice will further sharpen skills in identifying and interpreting combined candlestick patterns, thereby increasing forecasting accuracy in the unpredictable crypto market.
Identifying Bullish and Bearish Trends through Three-Line Strike Patterns in Cryptos
Identifying bullish and bearish trends through three-line strike patterns in cryptos can provide valuable insights for crypto market enthusiasts. The three-line strike is a candlestick pattern that indicates a potential trend reversal in price action. Understanding how to recognize this pattern can help traders make informed decisions regarding their investments.
A bullish trend signifies an upward movement in the market, while a bearish trend indicates a downward trajectory. The three-line strike pattern is typically observed after an extended rally or decline in prices.
In the case of a bullish trend, one should look for consecutive bullish candlesticks, where each closing price is higher than the previous one. Once there are three continuous bullish candles, the fourth candle opens lower than the third candle’s opening price and closes below the first candle’s closing price. This bearish candle extinguishes the preceding upward momentum, hinting at a possible reversal towards a bearish trend.
Similarly, when analysing for bearish trends, traders need to look for a series of bearish candlesticks leading up to the pattern formation. After three such consecutive candles, the fourth candle should open higher than the third one but fail to close above the first candle’s closing price. This breach of resistance suggests that the bulls are losing power, opening doors to a potential bullish-to-bearish shift.
When identifying these patterns, it is crucial to evaluate other indicators such as volume, volatility, and support/resistance levels for confirmation and reliability. Traders prefer high trading volumes accompanying these patterns as it increases their significance in predicting future price movements.
By closely observing three-line strike patterns on crypto charts and confirming them with other analytical tools, market participants can improve their abilities to anticipate bullish or bearish trends accurately. This knowledge can be useful for making profitable investment decisions or planning timely entries and exits within the crypto market.
Note: Successful trading in the crypto market depends on various factors and requires deep analysis beyond individual patterns like three-line strikes. Always conduct thorough research and consider employing risk management techniques to enhance the probability of success in this volatile marketplace.
Harnessing the Predictive Power of Gap Candlestick Patterns in the Crypto Realm
The world of cryptocurrency trading is vibrant and dynamic, constantly presenting new opportunities for investors. One essential tool that traders utilize to analyze market trends and make informed decisions are candlestick patterns. Among these patterns, one approach that has gained prominence in the crypto realm is harnessing the predictive power of gap candlestick patterns.
A gap refers to a break or space on a chart where no trading activity occurs between two periods. Gap candlestick patterns provide valuable insights into market sentiment and potential shifts in price movement. A gap can take various forms, such as the common gap, breakaway gap, runaway gap, or exhaustion gap. Each formation carries distinct implications for traders.
Some traders consider bullish or bearish gaps as potential indicators of price continuations or reversals. For instance, a bullish gap occurs when the opening price of a candlestick significantly exceeds the closing price of the preceding candlestick. This pattern often signals positive market sentiment and potentially further price increases.
Similarly, bearish gaps occur when the opening price of a candlestick significantly falls below the closing price of the previous session. Traders regard this pattern as a possible indication of negative sentiment and potential downward price movement.
Analyzing the size and occurrence of gaps allows traders to assess market momentum and predict possible market movements. Referred to as measuring gaps, they act as measurement tools to determine the strength of an ongoing trend or provide insights into trend reversals. Larger gaps may signify bolstered confidence among investors and suggest a stronger momentum in the direction signaled by the gap.
Moreover, monitoring multiple consecutive gaps assists traders in identifying possible continuation patterns in strong trends. When witnessing sequences of consecutive gaps going in the same direction, traders posit that the trend will likely persist for some time.
However, it’s vital to recognize that gap candlestick patterns alone should not serve as sole indicators for making investment decisions. To increase reliability, traders often incorporate additional technical analysis tools such as trend lines, moving averages, or oscillators. By combining various analytical techniques, traders create a more comprehensive depiction of market conditions and enhance the accuracy of their predictions.
It’s important to note that gap candlestick patterns are not infallible, and their predictive power may at times result in false signals. Crypto markets inherently involve volatility and risk, making it crucial for traders to exercise caution and consider multiple factors beyond just candlestick patterns.
In conclusion, gap candlestick patterns provide valuable insights into potential market movements and sentiment in the crypto realm. By analyzing the size, occurrence, and sequence of gaps alongside other technical analysis tools, traders can gain a clearer understanding of trends, reversals, or continuations. However, traders must combine this pattern with comprehensive research and multiple indicators to form a robust trading strategy in the ever-evolving world of cryptocurrencies.
Technical Analysis Tools and Indicators
Understanding Moving Averages in Cryptocurrency Trading

Moving averages are fundamental tools used in cryptocurrency trading to help traders understand price trends and make informed decisions. They create a smooth line that tracks the average price of an asset over a specific time frame. Traders mostly rely on the simple moving average (SMA) and the exponential moving average (EMA) to analyze market conditions.
The SMA calculation is straightforward; it sums up the closing prices of an asset over a specific period (e.g., 10 days) and divides it by the number of periods. This value produces a single average price, marking a point on the chart. As new data arrives, the oldest data point is dropped, and the newest one is added, each iteration recalculating the SMA anew.
On the other hand, EMA assigns more significance to recent price data compared to older data points. To calculate EMA, one first determines a multiplier based on the chosen time period. The multiplier decays the further back in time we go, reflecting reduced relevance of older prices. By utilizing this multiplier, each period’s EMA value depends not only on the close price but also on its previous EMA value.
In trading, moving averages are primarily applied for trend identification and signaling potential reversal points. Depending on trading strategies, traders look for the crossing of two moving averages or examine whether price action is above or below a moving average trend line.
Traders often watch for two key signals: a bullish crossover occurs when a shorter-term moving average crosses above a longer-term one, suggesting potential upward momentum in prices. Conversely, if a shorter-term moving average crosses below a longer-term one, this bearish crossover indicates possible downward momentum.
Another use of moving averages is as support and resistance levels. When prices fall towards a rising moving average and bounce back without breaking it, this typically signifies support. On the other hand, if prices rally towards a declining moving average and fail to surpass it, it usually acts as a resistance level.
Some traders combine multiple moving averages of different lengths to gain deeper insight into market trends. Understanding moving averages requires learning about different time frames, analyzing price behavior, and adjusting strategies accordingly.
It’s important to note that moving averages are lagging indicators, which means they may not reflect sudden price changes or market volatility. They are best used in combination with other technical analysis tools and indicators to increase effectiveness and accuracy.
Ultimately, comprehending moving averages is crucial for traders as it enables them to identify potential trends, determine support and resistance levels, and make more informed decisions when buying or selling cryptocurrencies.
The Power of Relative Strength Index (RSI) for Crypto Traders
The Relative Strength Index (RSI) holds immense value for crypto traders when evaluating market trends and making informed decisions. This powerful tool measures the magnitude and speed of price movements to determine if a particular asset is being oversold or overbought.
The RSI ranges from 0 to 100 and focuses on price momentum, gauging the strength of bullish or bearish conditions. Traders primarily utilize this index to identify potential entry or exit points based on market conditions.
When the RSI surpasses the 70 mark, it indicates an overbought condition in the market. In simpler terms, the price has escalated too quickly, making it ripe for a possible downturn. Conversely, when the RSI plunges below 30, it signifies an oversold must-buy situation, suggesting that the asset has been sold off excessively and might rebound soon.
Traders welcome the RSI as it aids determining favorable timeframes for entering or exiting trades. For instance, if the RSI climbs into overbought territory beyond 70 while prices hit resistance levels, traders may consider selling their positions to capitalize on potential profit-taking opportunities. Additionally, regarding oversold scenarios with RSI below 30 and prices nearing critical support levels, traders might opt to buy assets as a reversal is likely to follow shortly.
Divergence patterns are another indicator facilitated by RSI that crypto traders keep a close eye on. Bullish divergence refers to a notable price decline coupled with a rising RSI trendline. In contrast, bearish divergence entails increasing prices alongside a downward sloping RSI trendline. These divergences can be seen as hints towards forthcoming trend reversals.
While the RSI should never be used in isolation but rather in combination with other technical indicators and analysis, it significantly strengthens traders’ decision-making processes. By wisely applying this tool along with comprehensive market knowledge, traders potentially gain an edge by capitalizing on profitable trade setups and comprehending when it’s prudent to exercise caution.
Cryptocurrency markets are notoriously notorious for their volatility. The RSI, acting as a reliable companion, empowers traders to evaluate price momentum efficiently while enhancing the ability to make informed trading choices—ultimately increasing the chances of generating profits in this thrilling and ever-evolving market.
Exploring the Bollinger Bands: Volatility and Trend Analysis in the Crypto Market

Exploring the Bollinger Bands: Volatility and Trend Analysis in the Crypto Market
If you closely follow cryptocurrency market trends, you’ve probably come across various technical analysis tools utilized by traders. One such popular tool is Bollinger Bands – a specialized indicator that provides insights into both volatility and trend analysis.
Created by John Bollinger in the early 1980s, Bollinger Bands are plotted around (and encompass) a simple moving average (SMA). Comprising three lines, these bands help traders identify potential support and resistance levels and gauge market volatility in relation to the mean price over a given time frame.
The middle band of the Bollinger Bands is typically formed using a 20-day SMA, acting as a reference point for both the upper and lower bands. The upper band is created by adding two standard deviations to the SMA, while the lower band consists of two standard deviations subtracted from it. Therefore, as price fluctuations occur, Bollinger Bands adjust accordingly to reflect changing market conditions.
Volatility Analysis:
Bollinger Bands are ideal for determining market volatility. When cryptocurrency prices experience high volatility, the bands widen, indicating increased market excitement and potential trading opportunities. Conversely, during periods of low volatility, the bands contract, suggesting reduced trading activity and an imminent significant price movement.
It’s essential to note that wider width doesn’t necessarily imply bullish or bearish signals; rather, it signifies increased uncertainty and potential for greater price movements. Skilled traders combine Bollinger Bands with other indicators to assess the overall market context accurately.
Trend Analysis:
Besides volatility analysis, Bollinger Bands aid in discerning possible trends in the crypto market. When prices consistently touch or surpass the upper band, it suggests an overbought condition, possibly indicating that the uptrend could be nearing its end. In contrast, when prices repeatedly reach or go below the lower band, it highlights an oversold condition, indicating the potential for a trend reversal.
Traders use Bollinger Bands in conjunction with other analysis tools and technical indicators to identify trend continuations or potential reversals. Parallel upper and lower bands often indicate a steady trend. However, if the bands begin to move closer together, it might be an early warning sign of an imminent price breakout.
Expanding utilization:
Given the increasing interest in cryptocurrencies, more traders are incorporating Bollinger Bands into their trading strategies. By understanding the dynamics of volatility and trends through this indicator, market participants can make informed decisions when determining quick trades or developing long-term investment plans.
In conclusion, Bollinger Bands serve as a valuable tool for traders in the crypto market, offering insights into both volatility and trend analysis. By comprehending the behavior of these bands amidst changing market conditions, traders gain a better understanding of market sentiment and can capitalize on potential profit-making situations. Remember, it’s crucial to combine Bollinger Bands with other indicators to craft a well-rounded trading strategy tailored to your risk tolerance and investment goals.
How to Use Fibonacci Retracement Levels in Cryptocurrency Trading
Fibonacci retracement levels are a popular technical trading tool used by cryptocurrency traders to forecast potential price reversals and identify entry or exit points. The concept behind Fibonacci retracement relies on the idea that financial markets, including cryptocurrencies, often exhibit repetitive patterns based on natural occurrences.
To begin using Fibonacci retracement levels in cryptocurrency trading, you first need to understand the basic principles of this tool. The Fibonacci sequence is a series of numbers where each number is the sum of the two preceding ones, starting with 0 and 1 (0, 1, 1, 2, 3, 5, 8, etc.). Ratios derived from these numbers — primarily 0.382, 0.50 (or 0.618), and 0.786 — form the foundation for Fibonacci retracement levels. These ratios are believed to reflect key support and resistance levels in financial markets.
Identifying potential Fibonacci retracement levels involves selecting a significant swing low (bottom) and swing high (top) points on a cryptocurrency’s price chart. Using the Fibonacci tool on your trading platform, you can then draw horizontal lines at different ratios (mentioned above) between these two points.
The 0% retracement level represents the swing high while the 100% level corresponds to the swing low. Other Fibonacci retracement levels include the aforementioned ratios – namely 38.2%, 50%, and 78.6%. These additional levels tend to act as significant support or resistance areas where price reversals might occur.
Fibonacci retracement levels can provide valuable insights when used effectively in cryptocurrency trading strategies. Traders often watch for these levels aligning with other technical indicators (such as trend lines or moving averages) or fundamental analysis to confirm potential reversals or areas of value.
It is important to remember that Fibonacci retracement levels are not foolproof indicators and solely relying on them may lead to incorrect assumptions. Their effectiveness depends on market conditions, the chosen time frame, and wider market sentiment. Therefore, using these levels within a comprehensive trading strategy ensures proper risk management and reduces the possibility of false signals.
Finally, it’s worth noting that various trading platforms offer Fibonacci retracement tools that automatically calculate the levels for you once you identify the swing high and low points. This simplifies the process considerably, allowing you to swiftly apply Fibonacci analysis to multiple cryptocurrencies as part of your trading routine.
In conclusion, Fibonacci retracement levels in cryptocurrency trading can provide valuable insights when used alongside other technical and fundamental indicators. Traders leverage these ratios to identify potential support or resistance levels in order to anticipate price reversals. However, it is crucial to supplement Fibonacci analysis with an overarching strategy and be aware of its limitations.
MACD: Diving Into the Moving Average Convergence Divergence Indicator

The Moving Average Convergence Divergence (MACD) is a popular technical analysis indicator used in the crypto market. It’s widely employed by traders and investors to identify potential buying or selling opportunities based on price trends and momentum.
Basically, the MACD provides insights into both short-term and long-term stock price trends, indicating whether a particular asset is overbought or oversold. The indicator combines two moving averages, usually the 12-day Exponential Moving Average (EMA) and the 26-day EMA, along with a 9-day EMA called the signal line.
By subtracting the 26-day EMA from the 12-day EMA, we get the MACD line. This line represents the difference between the two moving averages and acts as an oscillator for market trends. A positive MACD line shows that the shorter-term moving average is higher than the longer-term one, indicating a bullish signal, while a negative MACD line suggests bearishness.
Moreover, the MACD is often accompanied by a histogram, positioned beneath the MACD line. This histogram displays vertical bars that represent the difference between the MACD line and its signal line. When these bars are above zero level, it indicates upward momentum (bullishness), while below zero level suggests downward momentum (bearishness).
Besides identifying trends, this indicator also generates signals such as crossovers and divergences. A bullish crossover happens when the MACD line itself intersects above the signal line—a possible indication to buy an asset. Conversely, a bearish crossover occurs if the MACD line crosses below the signal line—often interpreted as a selling signal.
Additionally, traders analyze divergences within the MACD indicator. Bullish divergence occurs when the price of an asset forms lower lows while the MACD makes higher lows, signaling a potential trend reversal to watch for. Conversely, bearish divergence implies higher highs forming on price charts while the MACD records lower highs, suggesting a possible trend reversal to the downside.
It’s important to remember that using the MACD indicator alone may not guarantee successful trading decisions. It is often employed in combination with other technical analysis tools and strategies to make more informed predictions about market movements.
By understanding the basics of the MACD indicator, crypto enthusiasts can enhance their market analysis and optimize their decision-making process when trading or investing in cryptocurrencies.
Unpacking the Stochastic Oscillator for Cryptocurrency Momentum Analysis
The Stochastic Oscillator is a powerful technical analysis tool that can be used to assess the momentum of a cryptocurrency. By unpacking the complex calculations and principles behind it, we can better understand its role in the crypto market.
At its core, the Stochastic Oscillator compares the closing price of a cryptocurrency to its price range over a specified period. This period is typically 14 days but can be adjusted according to one’s preference.
The indicator generates two lines, known as %K and %D, which oscillate between 0 and 100. They are represented graphically on a chart and are often plotted alongside the price data.
The %K line represents the current closing price relative to the high and low prices over the selected period. It is calculated using the following formula: (%K = (Closing Price – Lowest Low) / (Highest High – Lowest Low) * 100). This equation measures where the cryptocurrency price sits within the range.
The %D line, on the other hand, is a moving average of the %K line over a specified number of periods. Commonly, a three-period moving average is used for %D calculation.
Analyzing these lines helps traders identify potential trend reversals or overbought/oversold conditions. When %K crosses above %D below a specific threshold (often 20), it signals a potential buying opportunity, as it suggests that the price is climbing back from oversold levels. Conversely, when %K crosses below %D above a specific threshold (usually 80), it indicates an overbought condition and could be an opportune moment to sell.
Additionally, traders often watch for bullish or bearish divergence between the Stochastic Oscillator and price movement. Divergence occurs when there is a notable difference between these two indicators. Bullish divergence takes place when the price makes lower lows while the %K line forms higher lows, suggesting potential price reversal to the upside. Conversely, bearish divergence occurs when the price forms higher highs while the %K line makes lower highs, possibly indicating an upcoming downward trend.
Like any technical indicator, it’s important to use the Stochastic Oscillator in conjunction with other tools and not rely on it solely for trading decisions. False signals can occur in ranging markets or during times of extreme volatility, so it’s crucial to employ proper risk management strategies when interpreting the oscillator output.
Studying the Stochastic Oscillator can provide valuable insights into market momentum and potential entry or exit points for cryptocurrency traders. Monitoring this indicator alongside other relevant factors helps market participants stay tuned to dynamic price movements and make informed investment decisions.
Using Ichimoku Clouds to Anticipate Market Movements in Crypto Trading
Using Ichimoku Clouds to Anticipate Market Movements in Crypto Trading
When it comes to crypto market news, one tool that traders often use to anticipate market movements is called Ichimoku Clouds. Ichimoku Clouds is a technical analysis indicator that provides valuable insights into the direction and momentum of an asset’s price action. Instead of relying solely on one or two indicators, Ichimoku Clouds offers a holistic view of the market.
At its core, Ichimoku Clouds consist of five individual lines/indicators that work together to paint a comprehensive picture of the market. These lines include the Tenkan-sen (Conversion Line), Kijun-sen (Base Line), Senkou Span A (Leading Span A), Senkou Span B (Leading Span B), and the Chikou Span (Lagging Span). Each line plays a unique role in determining possible support, resistance levels, and trend direction.
The Tenkan-sen and Kijun-sen can help identify trend reversals and offer insights into potential entry or exit points. When the Tenkan-sen crosses above the Kijun-sen, it generates a bullish signal, indicating a potential buying opportunity. Conversely, a bearish signal occurs when the Tenkan-sen crosses below the Kijun-sen, suggesting a possible selling opportunity.
The area between Senkou Span A and Senkou Span B creates what is known as the “cloud” or “Kumo.” This cloud can indicate dynamic support and resistance levels. If prices are above the cloud, it suggests that the overall trend is bullish, while prices below the cloud indicate a bearish market sentiment. The thickness of the cloud further helps determine its strength, with thicker clouds signifying stronger support or resistance.
Another crucial element of Ichimoku Clouds is the Chikou Span, which represents current closing prices plotted backwards. When the Chikou Span is above historical prices, it confirms a bullish market, and when it is below historical prices, it confirms bearish sentiment.
Together, these elements of Ichimoku Clouds provide a comprehensive view of the market situation, allowing traders to anticipate potential price movements. Traders commonly use this analysis tool to not only identify entry and exit points but also evaluate the overall trend strength and confirm signals generated by other indicators.
In crypto trading specifically, where market volatility remains high, integrating Ichimoku Clouds into your analysis can be especially helpful. By considering its various elements such as the Conversion Line, Base Line, Leading Spans A and B, and Lagging Span, traders can gain a broader perspective on potential price breakthroughs and reversals in the crypto market.
As always, it’s important to remember that while Ichimoku Clouds provide valuable insights into market movements, they should not be solely relied upon for trading decisions. Cybersecurity threats, global news events, regulatory changes, liquidity issues, and overall market sentiment must also be taken into consideration when formulating your trading strategies.
The Importance of Candlestick Patterns in Cryptocurrency Technical Analysis
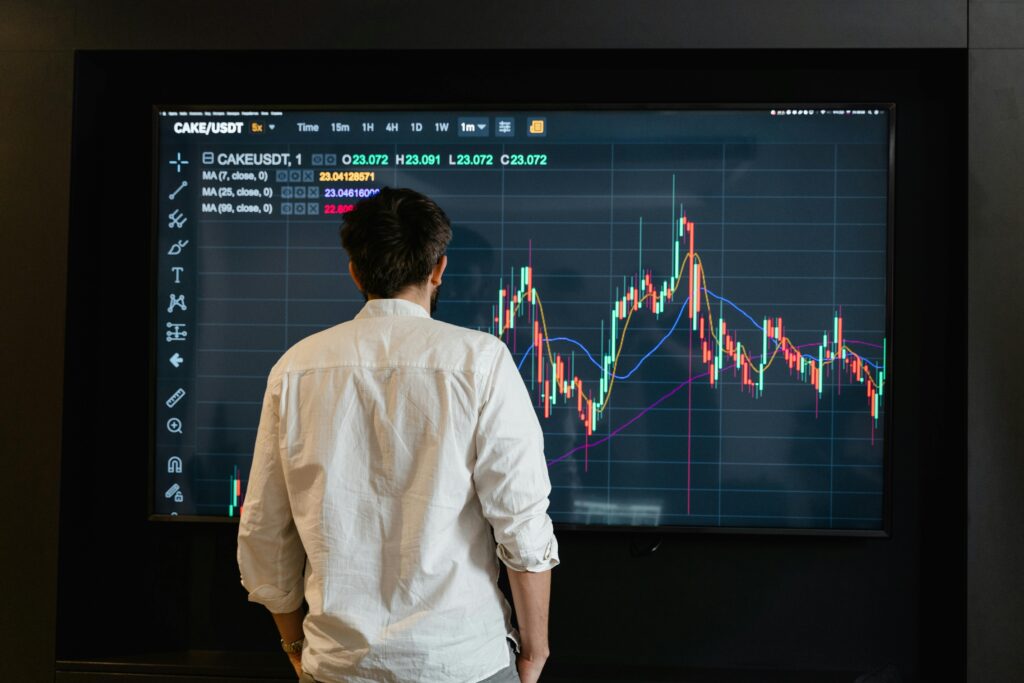
Candlestick patterns hold immense significance in cryptocurrency technical analysis. Their interpretation can provide valuable insights into market trends and potential price movements. By visually representing historical price data, these patterns assist traders in making informed decisions.
Each candlestick shape conveys crucial information about the cryptocurrency’s market sentiment during a given time interval (usually minutes, hours, or days). These candlesticks consist of a body and wicks (also known as shadows) at both ends.
Firstly, the body’s color represents whether the closing price (bottom/top of the body) was higher or lower than the opening price (top/bottom of the body). A green or white-filled body indicates a bullish sentiment: the closing price exceeded the opening price. Conversely, a red or black-filled body suggests a bearish trend where the closing price was lower than the opening price.
Furthermore, the length of the body reflects the intensity of buying or selling pressure. A long body implies a significant price movement, whereas a short body indicates minimal changes between opening and closing prices.
The upper and lower wicks represent the highest and lowest prices reached within that time interval. Longer shadows signify higher levels of volatility during that period. If the wick is absent, it implies that either high or low prices remain unattained.
Various candlestick patterns serve diverse purposes in technical analysis. For example, Doji candles highlight market indecision; they have almost equal opening and closing prices resembling a cross or plus sign. This pattern suggests an upcoming reversal but requires additional confirmation from subsequent candlesticks.
Hammer and shooting star patterns indicate potential trend reversals when occurring at important support or resistance levels. The hammer displays a long lower shadow with a small body near the high price, indicating buyers stepping in after a considerable drop. Conversely, a shooting star exhibits an unusually long upper shadow with a small body near the low price, implying sellers dominating after an uptrend.
Engulfing patterns occur when a small body candlestick is followed by a larger body candlestick opposite in color. Bullish engulfing patterns form when a downward trend is likely to reverse, whereas bearish engulfing patterns indicate the opposite.
These are just a few examples of the numerous candlestick patterns that traders rely on for technical analysis. Recognizing and understanding these formations allows market participants to anticipate potential price movements, making informed decisions about buying, selling, or holding their cryptocurrency positions.
Overall, incorporating candlestick patterns into crypto market analysis is crucial. They empower traders with insights into market sentiment, trend reversals, and potential levels of support or resistance. By deciphering these patterns accurately, traders enhance their ability to navigate the volatile world of cryptocurrencies effectively.
Volume Indicators: Analyzing Trading Activity in the Crypto Market

Volume indicators are tools used for analyzing trading activity in the crypto market. They provide valuable information about the number of shares or contracts traded over a specific time period. Analyzing volume can offer insights into the strength and sustainability of price trends, as well as potential reversal points.
One commonly used volume indicator is known as Volume Bar/Chart. It displays the total number of shares or contracts traded during each given period. Traders often compare the volume of current bars with previous bars to detect any significant changes that may impact market dynamics.
Another popular indicator is On-Balance Volume (OBV). This tool calculates the momentum between buying and selling volumes over a given timeframe. If the OBV line moves upward, it suggests that buying pressure is increasing and prices may rise. Conversely, downward movement indicates rising selling pressure.
Volume Weighted Average Price (VWAP) is another indicator used to assess market activity. VWAP takes into account both price and volume and calculates an average value representative of how much the asset was bought or sold at various prices throughout the trading day. This helps traders identify key support or resistance levels based on high trading volumes.
Additionally, Market Facilitation Index (MFI) measures the effectiveness of price movement based on trading volume. It indicates the ease with which assets can be bought or sold at current prices. High MFI values imply decreasing liquidity due to heavy buying or selling, potentially signaling an upcoming price reversal.
Overall, volume indicators help traders evaluate the level of interest in a particular cryptocurrency or trading pair, providing insights into market sentiment and potential future movements. By understanding the relationship between price and volume, traders can make more informed decisions when buying or selling assets in the crypto market.
Exploring the Parabolic SAR for Trend Confirmation in Crypto Trading

Exploring the Parabolic SAR for Trend Confirmation in Crypto Trading
The Parabolic Stop and Reverse (SAR) is a technical analysis indicator that can be utilized by cryptocurrency traders to confirm trends. Developed by J. Welles Wilder, Jr., this tool’s objective is to highlight potential entry and exit points with regards to price movements.
The SAR is represented by a series of dots either above or below the price chart. When positioned below, it suggests an uptrend, while dots placed above usually indicate a downtrend. These dots act as anchor points that dynamically adjust depending on price movements and provide potential support and resistance levels for traders.
One of the primary purposes of using Parabolic SAR is to help validate a trend before entering a trade. In crypto trading, it’s essential to differentiate between temporary price fluctuations and genuine trend reversals. By implementing the Parabolic SAR, traders can better grasp the momentum and strength of an ongoing trend.
To accomplish this, traders must observe the price in relation to the SAR dots. When prices remain consistently above the dot markers, it indicates an upward trend, signaling potential buy opportunities or retention of long positions. Conversely, when prices linger persistently under the SAR dots, it suggests a downtrend, indicating possible sell opportunities or maintaining short positions.
Moreover, changes in position for the Parabolic SAR dots present crucial information about trend reversals. If a dot switches from below to above the price line, it’s seen as a signal for investors to exit long positions or consider opening short positions. Conversely, when a dot shifts from above to below the price line, it indicates an opportunity to close short positions or potentially enter long positions.
While Parabolic SAR can offer useful insights into trends, it’s important not to rely solely on this indicator for decision-making. The effectiveness of all technical analysis tools depends on various factors such as market conditions, volatility, and risk tolerance. Therefore, it’s recommended to combine the use of the Parabolic SAR with other indicators, such as moving averages or volume analysis, to gain a comprehensive understanding of the market.
In summary, the Parabolic SAR is a versatile tool that crypto traders can use to confirm trends and determine optimal entry and exit points. It’s a dynamic indicator that adjusts based on price movements, highlighting potential support and resistance levels. However, it should be complemented by additional technical analysis tools to make well-informed trading decisions.
Utilizing On-Balance Volume (OBV) to Gauge Market Sentiment in Crypto

Utilizing On-Balance Volume (OBV) to Gauge Market Sentiment in Crypto
When it comes to analyzing the cryptocurrency market, traders often seek indicators that can help them make informed decisions. One such tool is the On-Balance Volume (OBV), which helps gauge market sentiment by measuring the volume of trades.
OBV is a technical analysis indicator developed by Joseph Granville, and its main focus is to track the cumulative volume of a particular asset over time. It takes into account both the price movement and volume data to provide insights into market sentiment.
The central idea behind OBV is that volume tends to precede price movements, as it reflects the underlying buying and selling pressure. By monitoring changes in OBV, traders can identify trends and potential shifts in market sentiment.
To conduct an OBV analysis, traders need access to historical trading data, typically presented as candlestick charts. They can manually plot the OBV line by starting with a base level and incrementing it for each period when there’s positive volume (buying pressure) while decrementing it when there’s negative volume (selling pressure). The resulting OBV line then provides a visual representation of market sentiment.
The OBV line can be further enhanced using moving averages or other technical indicators. For instance, employing a simple moving average (SMA) in combination with the OBV line can help identify potential buy and sell signals. When the OBV line crosses above its SMA, it signifies bullish momentum, suggesting a favorable time to buy. Conversely, crossing below the SMA indicates bearish momentum, indicating a potential time to sell or short.
Traders also pay attention to divergence patterns between price and OBV. When there’s bullish divergence, meaning prices are trending upward while OBV is declining, it suggests weakness and may signal an impending reversal or correction. On the other hand, bearish divergence occurs when prices are declining while OBV is rising, indicating a potential market reversal to the upside.
While OBV serves as a useful tool to gauge market sentiment, it’s essential to note that it isn’t foolproof and should be used in conjunction with other indicators and analysis methods. Furthermore, it’s vital to factor in external influences on the cryptocurrency market that can affect sentiment, such as regulatory developments, news events, or broader market trends.
In conclusion, On-Balance Volume (OBV) provides traders with an additional tool to assess market sentiment in the crypto space. It aids in identifying trends, potential reversal points, and evaluating buying or selling pressure. By incorporating OBV analysis alongside other technical indicators and fundamental analysis, traders can make more informed decisions in the dynamic and volatile world of cryptocurrencies.
Introduction to Elliott Wave Theory in Cryptocurrency Markets

Introduction to Elliott Wave Theory in Cryptocurrency Markets
The Elliott Wave Theory is a widely used tool in technical analysis that aims to understand and predict market cycles. Originally developed by Ralph Nelson Elliott in the 1930s, this theory is based on the concept that financial markets follow repetitive patterns driven by investor psychology.
According to Elliott, market movements can be classified into two types of waves: impulsive waves and corrective waves. Impulsive waves represent the main trend and typically consist of five sub-waves labeled as 1, 2, 3, 4, and 5. These waves push the market in the direction of the prevailing trend.
On the other hand, corrective waves act as counter-trend movements in between impulsive waves. Corrective waves are generally represented by three sub-waves and are labeled as A, B, and C. They are responsible for retracing a portion of the previously prevailing trend.
Each wave within an impulsive or corrective wave has specific characteristics that traders can analyze to identify the market’s position within a wave cycle. Various criteria such as price momentum, volume trends, and trading patterns are observed during this analysis.
The Elliott Wave Theory assigns different degrees or scales to each wave. Grand Supercycle is the largest degree while Subminuette represents the smallest degree of waves. Traders analyze multiple timeframes (such as weekly, daily, or hourly charts) to recognize these varying wave degrees and make accurate predictions accordingly.
Additionally, Elliott Wave practitioners use Fibonacci extensions and retracement levels to anticipate target prices for various waves within a given cycle. These Fibonacci ratios show potential resistance or support levels that can help traders execute buy or sell orders with calculated risk.
In cryptocurrency markets, where volatility is high, some traders find value in utilizing the Elliott Wave Theory analysis to gain insights into potential price movements. By identifying wave patterns and understanding their characteristics within cryptocurrencies’ price charts, investors can make more informed decisions.
However, it’s important to note that the Elliott Wave Theory is not infallible, and market behavior can deviate from what is expected. Therefore, traders need to utilize additional tools and indicators while combining wave analysis with other technical and fundamental analysis methods for successful trading in cryptocurrency markets.
By studying Elliott Wave Theory, investors can gain a deeper understanding of market cycles, trends, and potential price targets, thus enabling them to make more educated decisions based on historical patterns and projected waves in the cryptocurrency market.
Enhancing Trade Decisions with the ATR Indicator in Volatile Crypto Markets

The ATR (Average True Range) indicator is a widely used tool that can be utilized to enhance trade decisions, particularly in volatile crypto markets. Volatility refers to price fluctuations that occur within a specific time frame, and the ATR indicator measures this volatility by examining the average difference between high and low prices over a given period.
In volatile markets, accurate trade decisions become particularly crucial. The ATR indicator helps traders understand the potential risks and rewards associated with specific cryptocurrency assets. It enables them to gauge the overall volatility present in the market and make informed decisions accordingly.
When using the ATR indicator, it’s essential to identify an appropriate time frame. This will depend on individual trading strategies and preferences, but common periods often range from 10 to 14 days. By analyzing a broader range of periods, traders can grasp both short-term and long-term volatility patterns.
With the ATR indicator incorporated into a trading strategy, it becomes easier to determine suitable entry and exit points. Typically, when the ATR value spikes, it signifies increased market volatility, indicating potentially favorable trading conditions. Conversely, a decrease in the ATR value suggests reduced volatility and might indicate a cautious approach.
By understanding fluctuations in market volatility through the ATR indicator, traders gain insights into potential profit targets and stop-loss placement. Higher volatility could indicate larger price swings and greater potential for profits; however, it also carries higher risk. Moreover, considering your risk appetite is crucial before incorporating any indicators in your decision-making process.
It’s important to remember that indicators should not be solely relied upon for making trade decisions; they should be utilized as tools that complement extensive market analysis. A combination of technical analysis methods, including trendlines, support/resistance levels, and other indicators simultaneously with the ATR indicator can enhance accuracy.
In conclusion, implementing the ATR indicator into trade decisions can act as an effective navigation tool in volatile cryptocurrency markets. By understanding market fluctuations and anticipating potential risks or rewards, traders can make more informed decisions regarding entry and exit points, as well as profit targets and stop-loss orders. Combining the ATR indicator with other technical analysis tools provides a holistic view of the market dynamics, ultimately enhancing trading strategies in the volatile crypto market.
Combining Technical Indicators for a Robust Crypto Trading Strategy
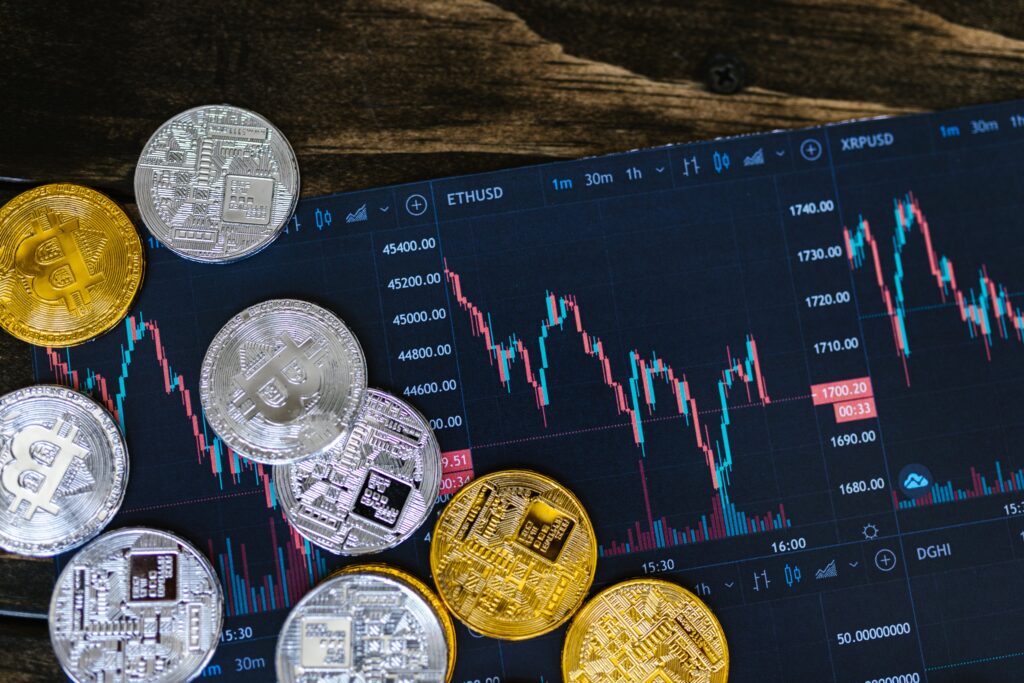
Combining technical indicators is an invaluable strategy for building a robust trading approach in the cryptocurrency market. Technical indicators are mathematical calculations applied to historical price and volume data to identify patterns, trends, and potential buy or sell signals.
One of the commonly used technical indicators is Moving Average (MA), which smooths out price fluctuations by calculating an average closing price over a specified period. By combining different MA durations, traders can observe the interaction between short-term and long-term trends, aiding in detecting potential entry or exit points.
Support and Resistance levels are another crucial concept. These levels represent previous price levels where the market has shown significant buying (support) or selling (resistance) pressure. By identifying areas with many historical occurrences of support or resistance, traders can gauge where trends may reverse or strengthen.
Relative Strength Index (RSI) is another popular indicator measuring the speed and change of price movements. By determining whether an asset is overbought or oversold, it helps traders assess potential trend reversals and find favorable entry or exit points. On RSI alone, values above 70 indicate overbought conditions while values below 30 indicate oversold conditions.
MACD (Moving Average Convergence Divergence) combines multiple exponential moving averages to study price momentum and potential trend changes. Traders analyze its signal line crossover with the MACD line as it represents buying or selling opportunities in the market.
Bollinger Bands plot standard deviations around a moving average to determine how volatile an asset’s price is. As prices tend to revert towards the mean when outside band ranges, traders can identify optimal entry or exit points based on such shifts in volatility.
Volume-weighted average price (VWAP) takes into account both the time of a trade and its traded volume. It provides valuable insights into institutional buying or selling patterns by calculating the average weighted price—taking volume into account—during a specific time window.
Fibonacci retracement levels are derived from the Fibonacci sequence, a mathematical concept found in various aspects of nature. These levels (38.2%, 50%, and 61.8%) are often used as potential support or resistance levels as they indicate pullback opportunities for traders.
It is crucial to mention that technical indicators should never be used in isolation. Successful traders combine these indicators and thoroughly analyze their interplay alongside other factors like market sentiment, news, and overall market conditions.
By combining and interpreting multiple technical indicators, traders can develop a robust strategy to identify potential buy or sell positions, manage risk, and ultimately increase the probability of profitable trades in the volatile world of cryptocurrencies.
The Role of Sentiment Analysis Tools in Predicting Crypto Price Movements
The role of sentiment analysis tools in predicting crypto price movements is gaining significant attention in the cryptocurrency market. Sentiment analysis involves analyzing and assessing investors’ emotions, opinions, and attitudes towards a particular cryptocurrency or the overall market.
These tools utilize advanced algorithms to analyze large amounts of data from various sources such as social media platforms, news articles, forums, and online communities. By applying natural language processing and machine learning techniques, sentiment analysis tools can extract valuable insights about investor sentiment.
Understanding sentiment is crucial because it can provide valuable information about market trends, emotional reactions, and investor behavior. Positive sentiment may indicate that investors are optimistic about a particular cryptocurrency’s future prospects, which could lead to an increase in demand and subsequently price appreciation. On the other hand, negative sentiment may suggest bearish signals, potentially leading to price declines as investors become more pessimistic.
Cryptocurrency sentiment analysis tools evaluate the overall sentiment by considering different factors such as the volume of positive and negative mentions, specific keywords and phrases related to buying or selling, changes in sentiment over time, and aggregated sentiment scores.
These tools help traders and investors make informed decisions based on real-time updates. By gauging the market sentiment surrounding a cryptocurrency, one can potentially predict price movements with greater accuracy. For instance, if a positive sentiment trend emerges regarding a specific cryptocurrency following the announcement of a major partnership or product release, it may signal an upward price movement.
However, relying solely on sentiment analysis tools for making investment decisions may not guarantee accurate predictions. While sentiment analysis provides valuable insights, market dynamics can be complex and influenced by numerous other factors beyond investor emotions alone. Price movements ultimately depend on various elements such as market liquidity, trading volumes, regulatory changes, technological advancements, and macroeconomic factors.
Moreover, sentiments expressed on social media platforms might not always align with actual investment decisions. Due to multi-directional bias and influence from speculative trends on social media platforms like Twitter or Reddit, it becomes crucial to judiciously assess the authenticity and reliability of sentiment information.
To enhance predictive accuracy, sentiment analysis tools can be complemented with fundamental and technical analysis. Combining sentiment analysis with traditional analytical approaches provides a more comprehensive view on market trends, strength of signals, and potential trading opportunities.
Ultimately, sentiment analysis tools serve as valuable instruments aiding investors and traders to gain insights into prevailing market sentiments and emotions. While it may not guarantee infallible predictions, when used alongside other analytical tools, they can contribute to making more informed and holistic investment decisions.
Technical Analysis Tools and Indicators
Understanding the Basics of Moving Averages in Crypto Trading

Moving averages are a fundamental analytical tool used in crypto trading. They provide valuable insights into market trends and help traders make more informed decisions. To understand moving averages, it’s crucial to grasp the idea of an average price over a specified period.
The most common type of moving average is the Simple Moving Average (SMA). It calculates the average price by summing up a specific number of closing prices and then dividing it by that same number. For example, if we want a 10-day SMA, we add up the closing prices of the last 10 days and divide that sum by 10.
Another type is the Exponential Moving Average (EMA). It assigns greater significance to recent price data by weighting them more heavily. This gives the EMA a faster response to market changes compared to the SMA.
Moving averages have multiple purposes in crypto trading. Firstly, they help identify trends and determine whether prices are moving up, down, or remaining flat. When the trend is upward, it implies bullish momentum, while a downtrend indicates a bearish sentiment.
Additionally, moving averages assist in filtering out fluctuations and noise caused by short-term market volatility. By smoothing out price data over time, traders can obtain a clearer picture of overall market direction.
Moving averages are frequently utilized to identify support and resistance levels. When prices approach a moving average from below and find support, it suggests potential buying opportunities as traders anticipate a rebound. Conversely, if prices test an established moving average from above and get rejected, it may indicate a resistance level that could signal sell opportunities.
Crossovers between different moving averages can generate trading signals. For instance, when a shorter-term moving average crosses above a longer-term one, it generates a bullish signal, while the opposite indicates bearish sentiment.
The choice of moving average period largely depends on personal preferences and trading strategies. Shorter periods yield more sensitive averages that react quickly to price changes; hence they may be suitable for day traders. Conversely, longer periods result in smoother averages that offer a broader view of market trends and might be preferred by swing or long-term investors.
Moving averages, however popular, have certain limitations. Like any technical indicator, they are not flawless and can generate false signals during volatile or unpredictable market conditions. Therefore, traders often combine moving averages with other indicators and tools to improve their decision-making process.
Understanding the basics of moving averages is a significant step forward in crypto trading analysis and decision making. Whether it’s identifying trends, filtering noise, spotting support and resistance levels, or generating crossover signals, these simple yet powerful tools enhance market understanding and can greatly contribute to profitable trading strategies.
The RSI Indicator: How to Use It Effectively in Your Crypto Trading Strategy

The RSI indicator, also known as the Relative Strength Index, is a popular tool used by traders to analyze price movements and identify potential trading opportunities in the crypto market. It is an oscillating momentum indicator that measures the speed and change of price movements, providing insights into whether a cryptocurrency is overbought or oversold.
To understand how to effectively use the RSI indicator in your crypto trading strategy, you should start with the basics. The RSI is typically depicted as a line graph that fluctuates between a value of 0 and 100. Values above 70 are generally considered overbought, suggesting a potential reversal or correction might occur soon. On the other hand, values below 30 are often seen as oversold, indicating a possible uptrend.
One aspect to consider while using the RSI indicator is divergences. Divergence occurs when the price of a cryptocurrency moves in the opposite direction to the RSI reading. For instance, if the price of a crypto asset continues to rise while the RSI is decreasing, it could suggest a trend reversal might be pending.
Another way to enhance your trading strategy with the RSI is understanding support and resistance levels. By analyzing price movements relative to these levels, you can create more informed buy or sell decisions. For example, if the RSI indicates that a cryptocurrency has hit an oversold level around major historical support, it might be an excellent opportunity to consider going long on that asset.
Moreover, understanding bullish and bearish signals signal an ability to capitalize on market fluctuations. Bullish divergence appears when the price decreases during oversold conditions, but the RSI creates higher lows. This indicates weakening selling pressure and might signal a potential buying opportunity depending on other market factors.
Conversely, bearish divergence happens when an asset’s price rises during overbought conditions, yet the RSI generates lower highs. As selling pressure weakens or increasing buying momentum slows, this can be taken as a potential sell or short-selling signal, albeit not one to rely on solely.
The duration and timeframe for applications of RSI vary widely. Shorter timeframes may provide more frequent signals but can also lead to increased false positives. Conversely, larger timeframes may give fewer opportunities but with higher accuracy. It’s vital to experiment with different time periods and backtest your strategy before committing capital.
It’s essential to remember no indicator works flawlessly all the time. The RSI is just one tool in your trading toolkit and should be complemented by additional analysis and indicators. Always consider other aspects such as market trends, candlestick patterns, volume, and fundamental analysis when crafting your trading strategy.
In summary, the RSI indicator is a valuable tool for crypto traders interested in analyzing price movements and identifying potential opportunities in the market. Understanding how to interpret RSI readings, spot divergences, analyze support and resistance levels, and recognize bullish or bearish signals can elevate your trading strategy and improve decision-making abilities. Remember to use the RSI in conjunction with other tools and indicators to drive better trading outcomes.
MACD – Deciphering the Signals for Crypto Market Movements

The Moving Average Convergence Divergence (MACD) is a popular technical analysis indicator used to decipher signals for crypto market movements. It is particularly helpful for traders and investors in understanding the trends and potential momentum shifts in the cryptocurrency market.
Essentially, MACD is composed of two moving averages plotted on a chart: the MACD line and the signal line. The MACD line is calculated by subtracting the 26-day Exponential Moving Average (EMA) from the 12-day EMA, while the signal line represents a 9-day EMA of the MACD line itself.
The interpretation of MACD revolves around its crossover points. When the MACD line crosses above the signal line, it generates a bullish signal suggesting potential upward movement in prices. Conversely, when the MACD line crosses below the signal line, a bearish signal is generated, indicating possible downward price movement.
One commonly used technique to identify trends with MACD is to observe divergences. If there is a bullish divergence, where the price creates lower lows but the MACD line forms higher lows, it can indicate an upcoming trend reversal or potential buying opportunity. Conversely, a bearish divergence occurs when the price reaches higher highs while the MACD line makes lower highs, indicating a possible trend reversal or selling opportunity.
Another aspect of MACD that traders consider is its histogram, which portrays the difference between the MACD line and the signal line. When positive bars are formed above the zero line, it implies increasing bullish momentum; conversely, when negative bars are formed below the zero line, it signifies increasing bearish momentum.
Additionally, traders often look for specific patterns in MACD to take trading decisions. One such pattern is called a bullish or bearish crossover. A bullish crossover occurs when the MACD line moves above its signal line, providing potential buy signals. In contrast, a bearish crossover happens when the MACD line drops below its signal line, creating sell signals.
It’s important to note that the accuracy of MACD signals depends on various factors and may not be foolproof. Therefore, many traders use MACD in combination with other technical indicators or tools to increase the probability of making accurate predictions.
In conclusion, MACD is a widely utilized indicator for analyzing crypto market movements. Its crossover points, divergences, histogram, and specific patterns provide valuable insights for traders seeking to identify potential opportunities in the cryptocurrency market while managing their risk effectively.
Bollinger Bands: Timing Your Buy and Sell in Cryptocurrency

Bollinger Bands: Timing Your Buy and Sell in Cryptocurrency
If you are involved in cryptocurrency trading, one tool that can significantly help you make better trading decisions is the Bollinger Bands. This technical indicator, developed by John Bollinger, serves as a useful guide for determining when to buy or sell cryptocurrencies based on price volatility.
So, what exactly are Bollinger Bands? Well, they consist of three lines plotted on a price chart – a simple moving average (SMA) line at the center, and two outer bands called the upper band and lower band. These bands dynamically adapt to market conditions by measuring asset price fluctuations over a defined period.
The middle line (SMA) represents the average price of the cryptocurrency over a specific time frame. It acts as an anchor, providing insights into the trend direction. The upper band reflects volatility and signifies that prices could be overbought. Conversely, the lower band indicates prices could be oversold due to increased volatility.
The idea behind Bollinger Bands is to identify potential buying or selling opportunities by analyzing patterns within the bands. For example, if the cryptocurrency’s price stays consistently near or touches the upper band, it might indicate an overbought condition, suggesting that selling could be imminent. Conversely, when the price hugs the lower band or approaches it closely, it may signal an oversold condition and possibly a good time to buy.
Beyond just indicating overbought and oversold conditions though, Bollinger Bands can also show periods of consolidation. When the bands’ distance narrows, it suggests decreasing market volatility or lateral movement within a certain price range. Traders should prepare for a potential breakout and possible significant changes in price trends.
Aside from identifying entry and exit points, traders can also use Bollinger Bands in conjunction with other indicators such as Relative Strength Index (RSI) or Moving Average Convergence Divergence (MACD) to increase the probability of accurate trading signals. Additionally, pattern recognition techniques can be applied to help identify chart formations such as triangles, reversals or breakouts, combined with Bollinger Bands.
It’s worth mentioning that no indicator guarantees 100% accuracy in predicting price movements; the market is always subject to unexpected turns. It is crucial to consider other factors such as fundamental analysis, news events, and broader market trends when making your trading decisions.
In conclusion, Bollinger Bands serve as a powerful tool in timing your buy and sell decisions within the cryptocurrency market. By monitoring price volatility and identifying overbought or oversold conditions, traders can gain valuable insights about potential entry or exit points. Remember to complement this indicator with other technical analysis tools while being aware of overall market conditions to maximize your trading success.
Fibonacci Retracement Levels: Finding Entry and Exit Points in Crypto Markets
Fibonacci retracement levels are an essential tool used in technical analysis to help traders determine potential entry and exit points in the crypto markets. Named after the famous mathematician Leonardo Fibonacci, this method involves the use of horizontal lines which correspond to key levels obtained through mathematical calculations.
To apply Fibonacci retracement levels, a trader initially identifies a significant price movement on a chart representing a cryptocurrency’s price action. This movement may be either an upward or downward trend, known as swings or waves. These swings can vary in length and are quantified using Fibonacci ratios, mainly 23.6%, 38.2%, 50%, 61.8%, and 78.6%.
Once the swing has been identified, the trader procedurally draws a line from the start of the swing to its end, marking these two points as 0% and 100% respectively. Subsequently, using the Fibonacci ratios mentioned above, parallel horizontal lines are drawn and marked on the chart at these respective percentages with respect to the length of the swing.
The resulting retracement levels then act as potential support or resistance areas where price reversals or continuing trends are likely to take place. When prices retrace or reverse back towards any of these levels, traders often pay close attention as these zones offer valuable insights.
In uptrends, fib retracement levels may be interpreted as buying opportunities. Traders often attempt to enter a position when cryptocurrencies’ prices drop to one of these levels since they indicate potential support areas. If price analysis shows bullish signals such as candlestick patterns or positive indicators, traders might consider it an optimal time to buy or increase their holdings.
Conversely, during downtrends, fib retracement levels might signal potential points for selling or shorting since they act as resistance zones where heightened selling pressure could emerge. If prices approach one of those levels accompanied by bearish reversal signals like bearish candlestick patterns or negative indicators, traders may view it as a suitable moment to sell or take profits.
Aside from entry and exit decisions, Fibonacci retracement levels can also help identify potential target levels within an ongoing trend. If prices break through the immediate retracement level, traders might look for subsequent fib extension levels such as 161.8% or 261.8% as possible profit-taking targets.
However, it’s important to note that Fibonacci retracement levels should never be solely relied upon for making trading decisions. They should always be used in conjunction with other technical analysis tools and indicators to validate signals. Analyzing both short-term and long-term trends, along with considering factors like market sentiment or news, is crucial for successful trading in the dynamic world of cryptocurrencies.
Ichimoku Clouds: A Comprehensive Guide for Crypto Traders

Ichimoku Clouds, also known as Ichimoku Kinko Hyo in Japanese, is a comprehensive technical analysis indicator that has gained popularity among crypto traders. Created by Goichi Hosoda in the late 1930s, this powerful tool provides valuable insights into the market trends, support and resistance levels, and potential reversals. In this comprehensive guide, we will delve into the various components of Ichimoku Clouds and how traders can effectively use it in the crypto market.
- Tenkan-sen (Conversion Line):
The first component of Ichimoku Clouds is the Tenkan-sen or Conversion Line. This line represents the average of the highest high and lowest low over a specific period, usually nine periods. It provides a tightly bound moving average that reacts quickly to short-term price movements. - Kijun-sen (Base Line):
The Kijun-sen or Base Line follows a similar approach to the Conversion Line but over an extended time frame, usually 26 periods. It offers a slightly lagging moving average than Tenkan-sen, providing traders with a mid-term perspective. - Senkou Span A (Leading Span A):
Using the average of Tenkan-sen and Kijun-sen plotted forward by 26 periods, Senkou Span A forms one edge of the cloud or “Kumo.” This leading span helps identify potential support and resistance areas in future price movements. - Senkou Span B (Leading Span B):
Similar to Senkou Span A, the Senkou Span B calculates an average over a distinct period (usually 52), but it is plotted forward by 26 periods. The area between Senkou Span A and B creates the other edge of the cloud. The width reflects market volatility. - Kumo (Cloud):
The cloud component of Ichimoku is formed by Senkou Span A and Senkou Span B. Traditionally, a green-colored cloud represents a bullish market sentiment, while a red cloud signifies a bearish sentiment. This feature serves as a dynamic support or resistance zone, enabling traders to gauge potential reversals. - Chikou Span (Lagging Span):
The Chikou Span, or Lagging Span as the name suggests, lags behind the current price by 26 periods. It helps confirm signals generated by other components of Ichimoku, acting as a momentum indicator when it breaks above or below recent candlestick patterns.
By considering the interactions between these different components and analyzing their relative positions in real-time charts, crypto traders can leverage Ichimoku Clouds to identify potential buy or sell signals. When the price moves above the cloud, it indicates bullish market conditions, while a move below suggests bearish momentum. Moreover, when the Conversion Line crosses above the Base Line within the cloud and both are moving upward, it generates a bullish signal; similarly, their bearish crossing within the cloud with downward movement generates a sell signal.
Traders should also focus on the cloud thickness since thicker clouds indicate stronger support or resistance levels. Additionally,rushing price movements through Kumo can provide valuable insights into potential trend continuation or reversals.
While mastering Ichimoku Clouds might take time and practice, incorporating its analysis effectively can greatly improve trading decisions in the volatile world of cryptocurrencies. Therefore, prudent utilization paired with other complementary analysis tools enhances traders’ understanding and potentially increases profitability in navigating cryptomarkets.
Stochastic Oscillator: Identifying Overbought and Oversold Conditions in Cryptocurrency Markets

The Stochastic Oscillator is a popular technical indicator used in cryptocurrency markets to identify overbought and oversold conditions. It was developed by George Lane in the 1950s and has since gained wide recognition among traders for its effectiveness.
In essence, the Stochastic Oscillator compares an asset’s closing price to its trading range over a specified timeframe. The indicator consists of two lines, %K and %D, which fluctuate between 0 and 100. %K represents the most recent closing price’s position within the trading range, while %D is a moving average of %K.
By analyzing these lines, traders can gauge whether an asset is overbought or oversold. When %K rises above a certain predefined threshold, usually 80, and then crosses below %D, it suggests that the asset is overbought and a potential sell signal might be approaching. Conversely, when %K falls below another threshold, often 20, and then crosses above %D, it indicates oversold conditions and potentially implies a buy signal.
The primary idea behind the Stochastic Oscillator is that after prolonged uptrends or downtrends, prices tend to revert to their mean value before continuing their trajectory. It helps traders identify potential turning points in the market, helping inform their buy or sell decisions. However, it is essential not to solely rely on this indicator but use it in conjunction with other technical analysis tools for more accurate predictions.
Traders often adjust the input parameters of the Stochastic Oscillator to suit their trading style and preferences. For instance, altering the number of periods considered while calculating the indicator may make it more or less sensitive to price movements.
Overall, the Stochastic Oscillator provides valuable insights into momentum and potential trend reversals in crypto markets. Efficient utilization of this indicator can assist traders in identifying overbought and oversold conditions, enhancing their decision-making process while navigating through volatile cryptocurrency markets.
The ATR Indicator: Assessing Crypto Market Volatility for Better Trade Decisions

The Average True Range (ATR) indicator is a widely used tool in the realm of technical analysis, specifically for assessing market volatility in the crypto market. As an essential component of a trader’s toolkit, ATR aids in making better trade decisions by providing insights into market conditions.
ATR measures the volatility of a cryptocurrency or any other market instrument based on its historical price data. The primary purpose of this indicator is to determine the average range at which prices move, indicating the level of volatility during a specific period. Traders can then utilize this information to analyze potential risks and rewards associated with specific asset trades.
The calculation behind the ATR indicator involves sampling high-to-low price range values over a chosen number of periods, usually 14 or 21 days. It accounts for any gaps between trading sessions and depicts the true price range by factoring in these irregularities. The resulting values are expressed in the form of absolute price units, revealing the current level of volatility.
A higher ATR value indicates greater volatility, suggesting that prices have experienced wider fluctuations over recent periods, thus highlighting increased risk. Conversely, a lower ATR value suggests calmer and relatively stable market conditions.
One way to interpret the ATR data is through comparative analysis. By contrasting the ATR values of different cryptocurrencies on various timeframes, traders can determine which ones exhibit higher or lower levels of volatility. This insight helps traders make informed decisions when choosing potential assets for trading activities.
The ATR indicator is also valuable for assessing potential stop-loss and take-profit levels for trades. By analyzing historical price data along with respective ATR values, traders can establish appropriate levels for safeguarding against adverse price movements while also considering profit targets.
Furthermore, the ATR indicator allows traders to adapt their strategies based on changing market conditions. During times of heightened volatility, suitable adjustments can be made by taking into account the augmented risks inherent in volatile environments. Traders may consider either widening their stop-loss distance or allocating smaller positions to mitigate potential losses.
In essence, the ATR indicator acts as a reliable and effective tool for assessing volatility in the crypto market. By providing key insights into price movements, it empowers traders to make optimal decisions when executing trades, managing risks, and establishing realistic profit expectations. No wonder it has found widespread utility among crypto market participants.
Candlestick Patterns Every Crypto Trader Should Know: A Visual Guide to Market Sentiment

Candlestick patterns are vital tools that every crypto trader should know about when analyzing market sentiment. These patterns, represented by graphical shapes on a price chart, provide insights into the emotions and psychology of market participants.
- Bullish Engulfing Pattern:
- – This pattern indicates a potential trend reversal from bearish to bullish.
- – It consists of a small bearish candle followed by a larger bullish candle that completely engulfs the previous candle’s body.
- – Indicates buyer dominance over sellers, suggesting the possibility of an uptrend.
2. Bearish Engulfing Pattern:
- – The opposite of the bullish pattern, the bearish engulfing pattern signals a potential trend reversal from bullish to bearish.
- – It comprises a small bullish candle followed by a larger bearish candle that engulfs the previous candle’s body.
- – Suggests that sellers are taking control and a downtrend might follow.
3. Hammer Pattern:
- – Generally occurs during a downtrend and marks a possible reversal towards an uptrend.
- – Consists of a small body with a long lower wick and little to no upper wick.
- – Signifies that buyers stepped in to push prices back up after a significant sell-off when market sentiment was negative.
4. Shooting Star Pattern:
- – Opposite of the hammer pattern, shooting star appears during an uptrend and implies a potential reversal towards a downtrend.
- – Identified by a small body with a long upper wick and little to no lower wick.
- – Shows that sellers entered the market during an upward movement, highlighting a possible shift in sentiment.
5. Doji Pattern:
- – A doji occurs when the opening and closing prices are almost identical, resulting in its cross-like appearance.
- – Symbolizes market indecision or a balanced standoff between buyers and sellers.
- – May indicate that current trends may be ending or undergoing a transition.
6. Morning Star Pattern:
- – A three-candle pattern appearing after a downtrend.
- – The first is a bearish candle, followed by a small bullish or bearish candle with a gap below the first, and then a larger bullish candle.
- – Suggests a reversal from a downtrend to an uptrend, indicating the emergence of buying pressure.
7. Evening Star Pattern:
- – The opposite of the morning star, it occurs during an uptrend.
- – Comprises of a bullish candle followed by a small bullish or bearish candle with a gap above the first, and then a larger bearish candle.
- – Implies a potential reversal from an uptrend to a downtrend, highlighting the entrance of selling pressure.
Understanding these visual representations of candlestick patterns in cryptocurrency price charts can assist traders in predicting potential market reversals and interpreting prevailing market sentiment. Regular analysis of these patterns can provide valuable insights into market dynamics.
Volume Analysis in Cryptocurrency Trading: Understanding Market Strength

Volume analysis is a crucial aspect of cryptocurrency trading that helps traders determine market strength and make informed decisions. Simply put, volume refers to the overall number of trading activity within a specific period. By evaluating volume, traders can gauge the level of investor interest in a particular cryptocurrency.
Analyzing volume provides insights into market movements and trend reversals. When volume increases significantly, it often accompanies notable price movements, indicating strong buying or selling pressure. Conversely, low volume suggests a lack of substantial market interest and potential instability.
Traders use various technical indicators to analyze volume. One widely used tool is the Volume Weighted Average Price (VWAP), which calculates the average price weighted by volume throughout a trading day. VWAP helps traders identify fair value prices and understand whether a security is overbought or oversold.
Another popular indicator is On-Balance Volume (OBV), which tracks the cumulative volume in relation to the price direction. If the OBV line rises steadily, it suggests stronger buying pressure, indicating bullish sentiment. Similarly, if the OBV line falls consistently, it indicates stronger selling pressure and bearish sentiment.
The analysis of volume can also help identify trend confirmations or divergences. For example, when prices rise alongside increasing volume, it confirms an uptrend’s strength. However, if the prices rise but accompanying volume decreases or remains stagnant, it suggests weakness and a possible trend reversal.
Additionally, analyzing volume can aid in spotting market manipulation or significant shifts in investor sentiment. Sudden spikes in volume during consolidation periods may precede major price movements driven by significant buy or sell orders. Recognizing such patterns allows traders to position themselves advantageously.
Using multiple timeframes to analyze volume can offer more comprehensive insights. Looking at daily, weekly, and monthly volume data enables traders to understand changing trends on different scales, from short-term momentum to long-term market sentiment.
Moreover, comparing current trading volumes with historical data allows for relative assessments, giving traders context about whether the current activity is above or below average. This approach helps identify periods of accumulation or distribution and assists in recognizing potential breakouts or reversals.
In conclusion, volume analysis is a key component of successful cryptocurrency trading, enabling traders to interpret market strength and plan their investments accordingly. Understanding volume patterns assists in identifying market sentiment changes, confirming trends, and unveiling potential opportunities for profit. By incorporating volume analysis into their trading strategies, cryptocurrency traders can make well-informed decisions based on concrete data rather than relying solely on price movements.
How to Combine Different Technical Indicators for a Robust Crypto Trading Strategy

Combining different technical indicators is an effective approach to develop a robust crypto trading strategy. Adding up multiple indicators allows traders to reduce false signals, increase the overall accuracy of predictions, and make more informed decisions. Here are some fundamental concepts to help you understand how to combine these indicators effectively:
Trend Confirmation: One popular technique is to combine trend indicators to validate market trends. Tools such as Moving Averages (MAs), Bollinger Bands, or Trendlines can be used together. By corroborating the signals produced by each of these indicators, traders can gain stronger confirmation of a trend direction.
Momentum and Oscillators: Combining momentum indicators, like the Relative Strength Index (RSI), with oscillators such as the Moving Average Convergence Divergence (MACD), can provide valuable insights into market conditions. For instance, if RSI indicates overbought levels while MACD displays bearish convergence, it suggests an impending trend reversal.
Support and Resistance Levels: Combining support and resistance tools like Fibonacci retracement levels, Pivot Points, and horizontal price lines can enhance trading decisions. When these levels align with other technical indicators indicating a potential trend change, it strengthens the validity of a trade signal.
Volume Analysis: Incorporating volume indicators, such as the On-Balance Volume (OBV) or Volume Weighted Average Price (VWAP), helps evaluate price movements in relation to trading volume. Higher volume at specific price levels could suggest significant support or resistance points.
Divergence Analysis: Divergence occurs when an indicator disagrees with the current price action. By fusing tools like the Stochastic Oscillator or Relative Strength Index with other indicators, you can identify divergences indicating potential trend reversals before they happen.
Pattern Recognition: Using different technical analysis patterns along with appropriate indicators enriches your understanding of market behavior. For example, combining candlestick patterns like Doji or Hammer with suitable moving averages and oscillators helps detect potential trend reversals or continuations.
It’s essential to note that a comprehensive understanding of individual technical indicators and their interaction is crucial while combining them. Traders should also consider the overall market context, news events, and risk management strategies.
Remember, every trading strategy carries inherent risks, as the market can be unpredictable. Thoroughly test and fine-tune your strategy on historical data before applying it to live trading. With experience, skill, and a strong understanding of technical analysis, combined indicator systems can greatly improve your crypto trading decisions.
Chart Patterns That Matter in Cryptocurrency Trading: Triangles, Head and Shoulders, Flags and Pennants
Chart patterns play a crucial role in understanding and predicting price movements in the cryptocurrency market. Three of the most significant chart patterns that matter in cryptocurrency trading are triangles, head and shoulders, and flags and pennants.
Triangles: Triangles are consolidation patterns that indicate a temporary balance between buyers and sellers. They are categorized into three types: ascending, descending, and symmetrical triangles. Ascending triangles exhibit a flat top trendline and a rising bottom trendline, signaling potential bullishness. Descending triangles possess a downward sloping top trendline and a horizontal bottom trendline, indicating possible bearishness. Symmetrical triangles present converging trendlines without any discernible slope, indicating indecision in the market.
Head and Shoulders: The head and shoulders pattern is a bearish reversal formation characterized by three distinct peaks. The first and third peaks (the shoulders) are lower in height than the center peak (the head), forming a visual pattern similar to a human’s head and shoulders. This chart pattern often indicates a trend reversal from bullish to bearish when it breaks below the neckline.
Flags and Pennants: Flags and pennants are shorter-duration continuation patterns that usually emerge after a sharp price movement. A flag pattern consists of two parallel trendlines: one representing the flagpole (the steep price movement) and the other as the flag itself (a period of consolidation). Bullish flags slope against the prevailing price trend, while bearish flags slope in favor of it. Pennants are similar to flags but have converging trendlines rather than parallel ones.
Why They Matter: These chart patterns matter because they can offer traders essential information about potential future price movements. Understanding these patterns aids in identifying breakout or breakdown points, confirming trend reversals, or recognizing the consolidation phase before resuming an existing trend. Recognizing these patterns can provide insights into price targets, entry/exit points for trades, and risk management strategies.
In conclusion, triangles, head and shoulders, and flags and pennants are valuable chart patterns that significantly impact cryptocurrency trading. Analyzing these patterns helps traders make informed decisions backed by technical analysis to navigate the ever-changing crypto market landscape effectively.
Using On-Balance Volume (OBV) to Uncover Momentum Shifts in the Crypto Market

On-Balance Volume (OBV) is a popular technical indicator that can be used to analyze momentum shifts in the crypto market. It serves the purpose of measuring the buying and selling pressure exerted on an asset over a given period of time. By understanding how OBV works, traders and investors can uncover valuable insights into market trends and make informed decisions.
To start with, OBV takes into consideration a simple premise: volume precedes price. This means that changes in trading volume often indicate potential price movements before they actually occur. Instead of focusing solely on price changes, OBV combines both volume and price action to provide a more comprehensive analysis.
The OBV indicator operates on the principle that positive volume should be added when prices close higher and subtracted when prices close lower. This cumulative volume is displayed as a line on an indicator chart, either above or below a zero line, depending on the underlying asset’s performance. If the OBV line moves upwards, it indicates that buying pressure is increasing, while a downward movement suggests growing selling pressure.
Traders and investors employ OBV to identify momentum shifts in the crypto market by using several key techniques:
Firstly, divergence analysis involves comparing the direction of OBV movements with actual price trends. If the price is moving downwards while the OBV line is moving upwards, it suggests that a potential trend reversal is brewing. Conversely, if prices are climbing but the OBV line is declining, it may indicate weakening buying power and signal an upcoming correction.
Secondly, trendline analysis can help identify trend confirmations or potential breakouts. By drawing trendlines on the OBV chart and comparing them with corresponding price trendlines, traders can gauge how buyers or sellers are influencing overall market sentiment. A breakout above or below a trendline on both charts could indicate a potential change in momentum.
Thirdly, use of support and resistance levels enhances the interpretation of OBV signals. When the OBV line encounters a significant support or resistance level corresponding with price action, it can strengthen the conviction in the upcoming trend continuation or reversal. If the OBV breaks through a support or resistance level alongside similar price movement, it further confirms the validity of the shift.
Lastly, analyzing OBV in confluence with other technical indicators can provide more reliable signals. Utilizing complementary tools such as moving averages, oscillators, or trend indicators strengthens the analysis. Confirming indications from multiple indicators can minimize false signals and increase confidence in spotting momentum shifts.
Overall, using On-Balance Volume to uncover momentum shifts in the crypto market is a valuable approach when analyzing trends and making trading decisions. Understanding how OBV uses volume to anticipate price movements, along with divergence analysis, trendline analysis, support and resistance levels, and considering other technical indicators can enhance accuracy when using this tool. By continuously monitoring OBV in conjunction with other relevant aspects of market analysis, traders can stay ahead of potential turning points and adapt their strategies accordingly.
The Importance of Relative Strength Index Divergence in Cryptocurrency Trading

The Relative Strength Index (RSI) is a crucial tool used by cryptocurrency traders to analyze market trends and predict potential price movements. However, it becomes even more powerful when traders pay attention to RSI divergence.
RSI divergence occurs when the trend of the RSI line deviates from the trend of the actual cryptocurrency price. This phenomenon often indicates that a trend reversal may be imminent and can provide traders with useful trading signals. By observing these differences between the RSI and price, traders gain insights into market sentiments and possible upcoming changes in direction.
A bullish RSI divergence suggests that despite the price indicating a downward trend, the RSI shows higher lows. This contrast may indicate underlying strength in the market, leading traders to anticipate an upcoming price increase. It indicates a potential buying opportunity as traders expect the price to reverse its downtrend soon.
Contrarily, a bearish RSI divergence occurs when the price continues to make higher highs while the RSI consecutively creates lower highs. This pattern might indicate weakness in the market and suggest that a downward trend reversal could take place. In such cases, traders can consider shorting or selling their holdings, capitalizing on an expected fall in prices.
Understanding and recognizing RSI divergence allows traders to assess market conditions beyond mere price analysis. Traders who solely rely on price patterns can miss these critical signals as they pay no attention to confirmation or disagreement presented by the RSI line.
Ultimately, incorporating RSI divergence analysis as part of your trading strategy empowers you with a complementary tool for verifying market trends and making well-informed investment decisions. By staying attentive to both price movements and RSI shifts, you can enhance your accuracy in predicting future cryptocurrency price actions.
Moreover, utilizing other key technical analysis indicators along with RSI divergence will further refine your insights into potential market moves. Always remember that analyzing multiple indicators in combination produces more reliable results compared to relying solely on one.
In summary, along with monitoring the RSI indicator, incorporating RSI divergence analysis into cryptocurrency trading strategies is crucial. Identifying these divergences enables traders to make more informed decisions and boosts their confidence in seizing profitable opportunities. By unearthing hidden signals, traders can navigate uncertainties and better position themselves in the volatile and ever-changing crypto market.
Applying the Concept of Elliot Wave Theory in Crypto Market Prediction

Elliot Wave Theory is a widely-used concept among technical analysts for predicting market trends. By analyzing price patterns, it aims to identify recurring and predictable wave movements in financial markets, such as cryptocurrencies. In the context of the crypto market, applying Elliot Wave Theory can provide insights into potential future price movements.
The theory is based on the premise that markets move up in five waves (bullish phase) and correct down in three waves (bearish phase). Furthermore, these waves are labeled with numbers and letters according to a specific structure. The idea behind this theory is to decipher the collective psychology of market participants, which reflects the ongoing struggle between buyers and sellers.
Here’s a breakdown of how Elliot Wave Theory is applied in crypto market prediction:
- Wave Count: In Elliot Wave Theory, the market is divided into different waves where each wave represents a specific trend or correction. Traders try to identify these waves to get a comprehensive view of market behavior.
- Impulse Waves: The five-wave upward movement, often referred to as an impulse wave, indicates a bullish trend. This movement consists of three upward waves (1, 3, 5) and two downward correctional waves (2, 4).
- Corrective Waves: After the impulse waves come corrective waves – three downward moving waves (A, B, C) that usually retrace a significant portion of the previous impulse wave’s rally. These corrections help balance and stabilize the market.
- Trend Reversals: Recognizing wave structures becomes crucial when anticipating trend reversals in the crypto market. Traders look for signs that confirm the end of one major wave count and the start of another reversal pattern.
- Fibonacci Retracement: Elliot Wave Theory often integrates Fibonacci retracement levels to predict potential areas of support or resistance during price corrective moves.
- Time Frames: Applying Elliot Wave Theory can happen on various time frames ranging from minute charts to weekly or monthly charts. It’s important to decide on the time frame that aligns with your trading strategy and the market you are analyzing.
- Flexibility and Subjectivity: Applying Elliot Wave Theory requires some subjectivity as identifying waves is not always clear-cut. Traders may interpret the wave count differently, leading to slightly different predictions.
- Practice and Experience: Mastering Elliot Wave Theory in crypto market prediction takes practice and experience. Traders often utilize chart analysis tools and indicators to validate their interpretations and gain more confidence in their wave counts.
Overall, it’s important to remember that no trading theory or strategy guarantees absolute accuracy, including Elliot Wave Theory. As with any technical analysis tool, it’s essential to combine multiple indicators, risk-management strategies, and fundamental analysis when making investment decisions related to cryptocurrencies. Success in forecasting market movements comes with learning, adapting, and understanding statistical probabilities over time rather than relying solely on a single concept like the Elliot Wave Theory.
Heiken Ashi Candles: Smoothing Out Price Action for Better Trend Analysis in Crypto Trading

Heiken Ashi candles are a popular tool used in technical analysis for better trend analysis in crypto trading. These unique candles are designed to “smooth out” price action, providing traders with a clearer picture of the market trends. Unlike traditional candlestick charts, Heiken Ashi candles focus on smoothing the price data to help identify long-term trends and avoid getting caught up in short-term market noise.
The name “Heiken Ashi” is derived from Japanese words, where “Heiken” means “average” or “balance,” while “Ashi” represents “bars” or “candles.” By balancing the market fluctuations, these candles aim to overcome the erratic movements commonly seen in cryptocurrency markets and enable traders to make more informed decisions.
Rather than relying solely on open, close, high, and low prices (like traditional candles), Heiken Ashi candles consider a combination of the current and previous bars’ data. The formula for calculating Heiken Ashi candlestick values involves four key components: opening price, closing price, high price, and low price. Based on these inputs, each candle is calculated using its own unique formula.
One key characteristic of Heiken Ashi candles is their ability to filter out noise created by random price fluctuations. By doing so, they offer clearer indications of the overall market trend and potential trend reversals. Traders can benefit from using them to spot price patterns and better understand market dynamics because these candles often show more consistent trends when compared to regular candles.
The color-coding system used in Heiken Ashi candles adds another layer of simplicity for trend identification. Typically, green signifies an uptrend, while red represents a downtrend. This visual representation can assist traders in making quick and intuitive decisions based on the current market sentiment.
It’s important to note that Heiken Ashi candles alone should not be relied upon as the sole indicator for trading decisions; they’re typically utilized as a supplementary tool along with other technical indicators. Price chart analysis using these candles is subjective and depends on the individual trader’s interpretation.
In summary, Heiken Ashi candles offer traders an alternative perspective on traditional candlestick analysis. By smoothing out the price action and reducing market noise, they provide a clearer view of market trends in crypto trading. Understanding the nature and usage of these candles can be beneficial for traders seeking more reliable trend signals and improved decision-making in the crypto market.
Utilizing Parabolic SAR for Determining Momentum Direction and Potential Reversals in Cryptocurrency Markets
Parabolic SAR (Stop and Reverse) is a popular technical indicator utilized by traders to determine the momentum direction and potential reversals in cryptocurrency markets. This tool provides important insights into market trends and helps traders make informed decisions. So, how does Parabolic SAR work?
The Parabolic SAR indicator appears as a series of dots either above or below the price chart. These dots represent potential reversal points in the current market trend. When the dots are positioned below the price, it signals an uptrend, while dots above the price indicate a downtrend.
In terms of momentum direction, Parabolic SAR offers valuable information on possible trend continuation or change. During an uptrend, the SAR dots remain beneath the price, illustrating that buyers are in control. Conversely, when the dots shift above the price bar, it suggests a potential trend reversal and a shift towards a downtrend.
Traders interpret Parabolic SAR in relation to the analyzed cryptocurrency’s price movement. When the price crosses above the SAR dot, it indicates a potential bullish signal. On the other hand, a price crossing below the SAR dot is considered bearish and may foreshadow a downtrend.
The distance between the price bar and the SAR dot can provide insight into the market’s momentum strength. A wider gap signifies stronger momentum, indicating an extended trend. However, caution must be exercised if this gap widens significantly as it might imply an eventual reversal or exhaustion of the trend.
At times, Parabolic SAR dots might converge towards or even overlap with each other directly following a significant move in either direction. This scenario could imply indecision or lack of clear momentum direction. Traders should exercise caution during such periods and await confirmation by looking for other indicators or patterns.
Additionally, combining Parabolic SAR with other technical indicators can enhance decision-making accuracy. Popular complementary indicators include moving averages, Relative Strength Index (RSI), and Bollinger Bands.
In conclusion, employing the Parabolic SAR indicator simplifies the identification of momentum direction and potential trend reversals in cryptocurrency markets. By inspecting the location of the dots in relation to the price, traders can determine the prevailing trend. Moreover, paying attention to the convergence or divergence of the dots with price movements assists in estimating market momentum strength and identifying potential reversal points. Nonetheless, as with any tool, it is wise to confirm Parabolic SAR signals by considering other indicators or patterns before making trading decisions. Happy trading!
Pivot Points Calculation and Its Significance in Identifying Critical Support and Resistance Levels for Cryptos

Pivot Points Calculation is a widely used tool in technical analysis for determining critical support and resistance levels within the cryptocurrency market. These levels carry substantial significance as they assist traders in making informed decisions regarding potential entry points for buying or selling.
The calculation of pivot points involves five simple steps. To begin, one must calculate the pivot point itself. This is accomplished by adding the high, low, and closing prices of the previous trading session, then dividing the sum by three. The resulting value represents a key level that showcases the overall sentiment of the market.
Once the pivot point has been determined, key support and resistance levels are calculated using the following formulas. First, an upper resistance level (R1) is calculated by multiplying the pivot point by two and then subtracting the previous day’s low. A lower support level (S1) is derived by multiplying the pivot point by two and subtracting the previous day’s high.
Additionally, a second resistance level (R2) is identified by adding the pivot point to the difference between yesterday’s high and low. Conversely, a second support level (S2) can be calculated by subtracting the difference between yesterday’s high and low from the pivot point. Lastly, a third resistance level (R3) can be obtained by adding yesterday’s high to twice the difference between the pivot point and low. Similarly, a third support level (S3) can be derived from yesterday’s low minus twice the difference between yesterday’s high and the pivot point.
Undoubtedly, Pivot Points Calculation plays a vital role in cryptocurrency trading as it helps identify critical levels that indicate major price movements or potential reversals. When prices approach these levels, they act as powerful markers for both support and resistance zones.
When a cryptocurrency’s price exceeds its first or second resistance level (R1 or R2), it often indicates bullish momentum in which buyers overpower sellers. This may push prices higher as a result. Conversely, if a cryptocurrency’s price breaches its first or second support level (S1 or S2), it could signal bearish momentum indicating that sellers are dominating the market. This scenario frequently leads to a decline in prices.
By keeping track of these levels provided by Pivot Points Calculation, traders can gain valuable insights into potential reversals or breakouts within the crypto market. Whether a trader utilizes pivot points in conjunction with other technical indicators or decides to trade solely based on these levels, they represent a crucial tool for decision-making in the challenging and dynamic cryptocurrency landscape.